Coherent Investor September 2016
September 19, 2016

Each day’s movement in the stock market averages adds to our knowledge of the market’s health. From time to time, it is important to step back and review the bigger picture, where we have been and where we are now, so that we can better assess what might be ahead. This is one of those times.
I have written several articles this year alone describing the market’s fundamental health in terms of trends in company sales, earnings, and margins. Before we begin the last quarter of 2016, I want to review where we are in context of the market’s longer-term price trend. After all, it is the market’s price movement which pays investors.
“The stock market is human nature on display.”
I want to share three things with you today.
- The most recently completed market cycle
- Which cycle are we in today and how far along
- What we expect at this time going forward
About Stock Market Trends And Cycles
A quick primer before we begin. Stock markets trend up, down and sideways1. A series of higher highs and higher lows make up-trends. Conversely, lower highs and lower lows make down-trends. One up-trend and subsequent down-trend complete one market cycle, measured from low to low.
“A given day may be part of multiple trends existing simultaneously along different time frames.”
A given day may be part of multiple trends existing simultaneously along different time frames (also known as degrees of trend). For instance, an up-day can fall within a short-term down-trend, which can be part of a medium-term sideways trend, which itself is a pause in an otherwise long-term up-trend.
How long is long-term? Each investor must define for themselves what constitutes a longer-term trend versus shorter-term trend relative to their time frame of interest. For us at Coherent Financial Advisers, the time frame of interest for tactical portfolio management generally is a business cycle of several quarters. Therefore, longer-term trends run a few years to a decade or more, while shorter-term trends last several weeks to a few months.
Ghost of Market Cycles Past
To better understand where we are today, it is helpful to see where we’ve been. I have prepared a long-term chart2 of the S&P 500 Index showing the three most recent long-term trends (figure-1). We will dissect each trend for closer inspection. The three trends are:
- The 1982 to 2000 secular bull market
- The 2000 to 2009 secular bear market
- The 2009 to present bull market
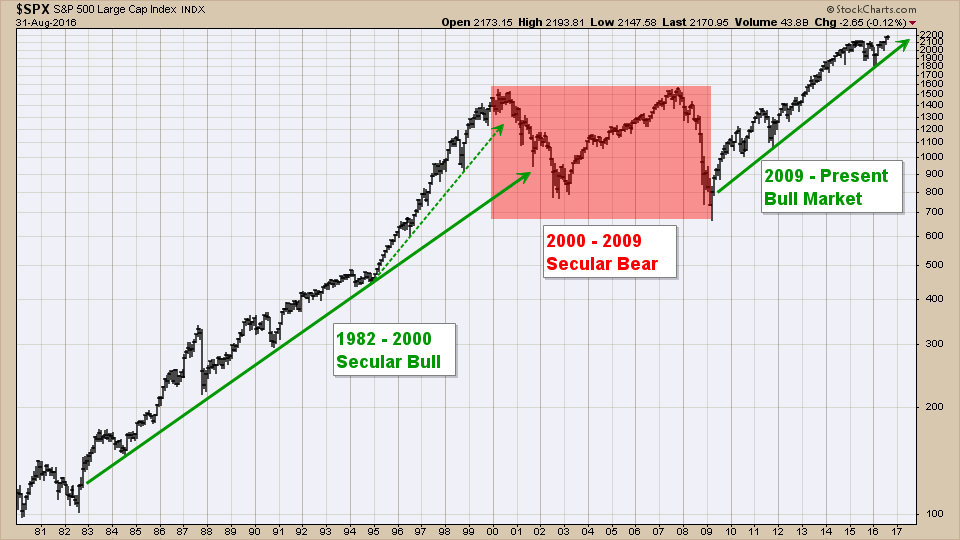
The stock market began a new secular up-trend in 1982, following a 16-year bear market from 1966. This spectacular bull market lasted 18-years, and multiplied some 14-fold. It ended in an equally spectacular 5-year “blow-off” move from 1995, part of which was taken back by the subsequent bear. This 10-year bear market corrected the 1982 up-trend and completed one full secular cycle lasting almost 30 years.
“To better understand where we are today, it is helpful to see where we’ve been.”
The 10-year bear market from 2000 through early 2009 included two shorter corrections declining more than 50% each (figure-2). The first down-leg started in 2000, and the second in late 2007. These two corrections sandwiched the 2003-2007 bull market which was simply a subset of a longer-term bear market.

The full market cycle from 1982 through 2009 exemplifies a vitally important point. To asses where we might be going, we must understand where we are within the context of trends on multiple time-frames.
For instance, Tuesday, May 25, 2004 closed up 1.6%, recording an outstanding single-day performance. This day was part of the May-June up-swing. The May up-swing was the fourth of five legs comprising the correction from March through August 2004, one of several corrections in the 2003-2007 bull market, sandwiched within the longer term 2000 bear market.
So, yes, Tuesday, May 25, 2004 was indeed a great day – smack dab in the middle of a bear market that gave back more than half of all gains made in recorded history.
Ghost of Market Cycles Present
So, where in the market’s trend are we today? We are presently 7-years into a bull market which began with the intra-day lows set on March 6, 2009. We can glean from seven years of market price movement by dividing it logically into smaller segments.
“We are presently seven months into the third cycle, and seven years into the 2009 bull market.”
The thicker solid green line in figure-3 marks the support lows of the 2009 bull market’s up-trend, designating it the market’s major support line. This major support line has been tested twice so far, once in late 2011 and again in February of 2016. Each test marked the end of a shorter-term cycle.
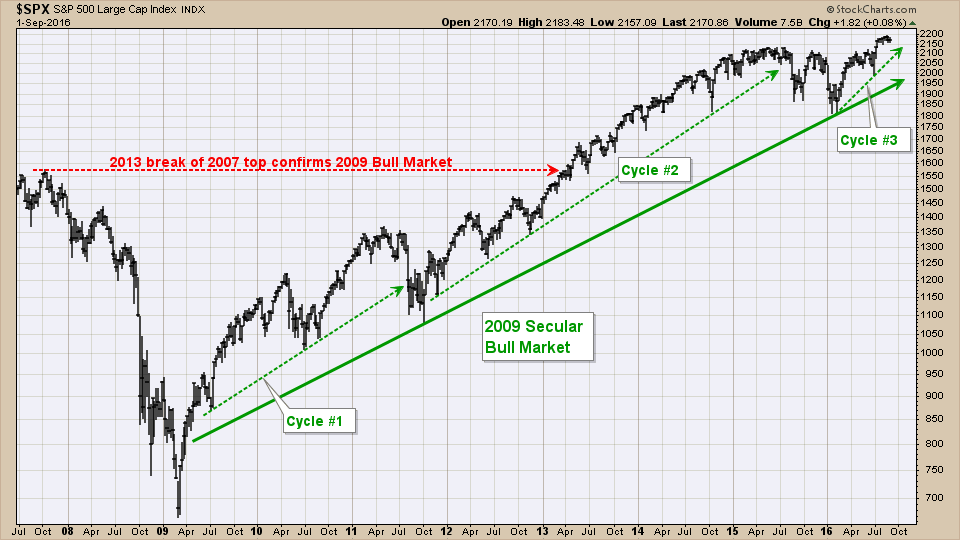
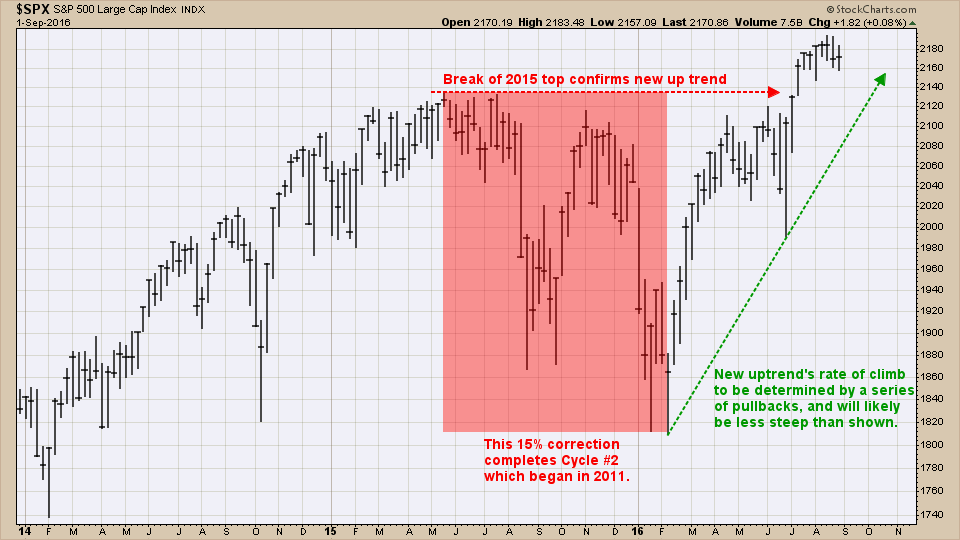
The 2011 correction ended the first cycle indicated on the chart by the dashed green line noted “Cycle #1”. You will note that this first cycle itself was composed of two shorter 12-month cycles, with the first ending in mid-2010. The year-long correction which ended in February marked the end of cycle #2.
We are presently seven months into the third cycle, and seven years into the 2009 bull market.
The first cycle doubled over 10-quarters and corrected 20%. The second doubled over 4-years and corrected 15%. I suspect that the third cycle will likely set a record, but not for being the longest or the tallest.
Ghost of Market Cycles Future
Where might the market’s 2009 up-trend go from here? It will take a few pullbacks to determine the rate of climb for this third cycle. In up-trends, the market makes higher highs with each pullback until…
“In up-trends, the market makes higher highs with each pullback until…”
At some point, the major support trend line of 2009 will be tested for the third time. I believe that major support will be broken on the third test. This new subsequent bear market will correct not just the shorter-term third cycle we are in now, but part the 2009 up-trend as well.
However, I do not believe – as some fear – that the subsequent bear market will be of the same scale as those in 2000 or 2007. These corrections were subcomponents of a larger, longer, 10-year secular bear market. In contrast, the next bear market will more likely give back some of the 2009 up-trend, but not all of it (as when the 2007 bear market gave back all of the 2003 bull market).
Being Prepared
Combining market price behavior (technical analysis) with trends in sales and earnings (fundamental analysis) helps in determining where we are in the longer-term trend of the market. The stock market is human nature on display. Invariably, markets become irrational near tops and bottoms.
That’s not necessarily a bad thing, if you are aware of it and prepared for it.
Warm regards,
Sargon Zia, CFA
September 19, 2016
You are welcome to comment!
Published regularly, the Coherent Investor series focuses on the current conditions of the securities markets as interpreted by the author and Chief Investment Officer, unifying multiple investment disciplines including fundamental and technical analysis.
Footnotes:
- Price trends cannot be properly observed on a chart using an arithmetic price scale. The price scale must be geometric or logarithmic due to the compounding nature of market returns. This is a common error among amateurs, and far too many professional practitioners.
- All price charts produced using www.stockcharts.com
CONTACT US FOR A COMPLIMENTARY CALL
We look forward to discussing your unique financial goals and personal values!
GET STARTED