Managing Your 401k Part 2
November 29, 2016

In part-2 of this series, we turn our attention to designing the stock portion of a retirement plan using a logically ordered, coherent process. We will create a complete benchmark-neutral portfolio, from which we will design an alternate allocation to enhance performance and make adjustments for changing market conditions.
“Following a logically ordered, coherent process is key to designing a sensible portfolio allocation.”

Recapping Part-1
The principles we cover throughout this series are additive. Before delving further, let’s recap some highlights from part-1.
- Managing your retirement account should be approached from both a financial planning and an investment management perspective. This article discusses the latter.
- Start at the beginning. Our financial plan guides our target asset allocation1 and appropriate benchmark2. We assembled factsheets for our plan’s fund choices.
- The bond index fund we nicknamed “Bond-B” approximates our fixed income benchmark. Combining Bond-B with the more actively managed Bond-A yielded a higher risk adjusted return.
Having completed the bond allocation in part-1 of this series, we now turn our attention to the stock portion of our hypothetical retirement plan.
Portfolio Design Objectives
Following a logically ordered, coherent process is key to designing a sensible portfolio allocation. We can apply this process to designing the whole portfolio or its subcomponents, being mindful to use the appropriate benchmark. Our portfolio design objectives are to:
- Design a benchmark-neutral reference portfolio
- Determine if remaining funds enhance performance
- Adjust holdings based on probable market trends
- Name That Chicken!
Markets change. Attaining the “super-optimal” portfolio is a futile goal which misses the big picture.
Designing a Benchmark-Neutral Portfolio
A benchmark-neutral reference portfolio is the “sun” around which all other alternative allocations revolve. To maintain focus on the design process, we will consider target date and balanced funds separately in part-3.
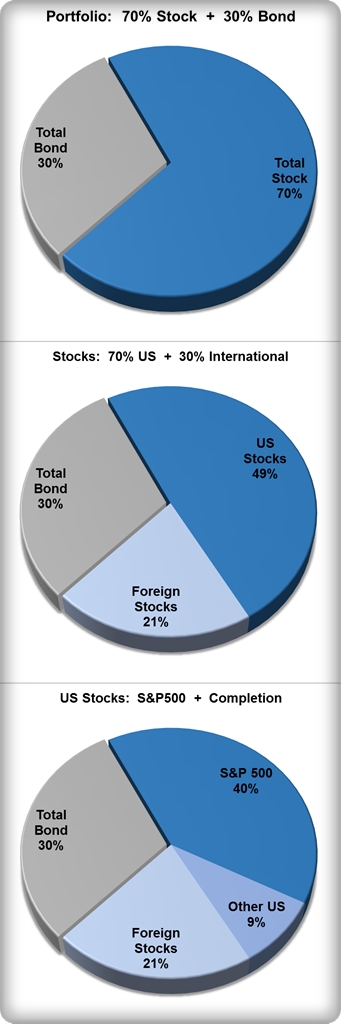
Our overall asset allocation calls for investing 70% in stocks (equities), and 30% in bonds (fixed income). Graphically, this looks like the first pie chart.
The equity benchmark is composed of the broad world equity market, split 70% US and 30% abroad4. Therefore, our account will hold 30% bonds, 49% US stocks, and 21% international stocks as illustrated by the middle pie chart.
Our 49% US stock market is benchmarked to the broader Russell 3000 index3, not the S&P 500. But our plan offers an S&P 500 index fund, not a Russell 3000 … or does it?
No Russell 3000 Index Fund? No problem!
Our plan sponsor graciously included a “completion index” or “extended market” fund. A completion portfolio consists of the broader US market excluding the S&P 500. Combining a completion portfolio in the right proportion with an S&P 500 index fund approximates the broader US stock market, while allowing for adjustments. There are several means of calculating a market-neutral mix of the total US market.
- Inference: since the S&P 500 constitutes roughly 80% of the total US stock market versus the Russell’s 98%, a 9:1 ratio makes sense.
- Mean-Variance: successive approximation yielded an 83:17 ratio.
- Regression analysis: super-geeks, knock yourselves out!
“Attaining the super-optimal portfolio is a futile goal which misses the big picture.”
Using mean-variance (reward-risk) analysis, the overall portfolio breaks down as illustrated in the last pie chart. If you’re curious how the risk-reward analysis looks, click on the thumbnail5.
Of the three international stock funds our plan offers, one is clearly an index fund. Our reference benchmark-neutral portfolio is now complete!
-
30% Bond market index fund, “Bond-B”
40% S&P 500 index fund
09% Completion index fund
21% International index fund
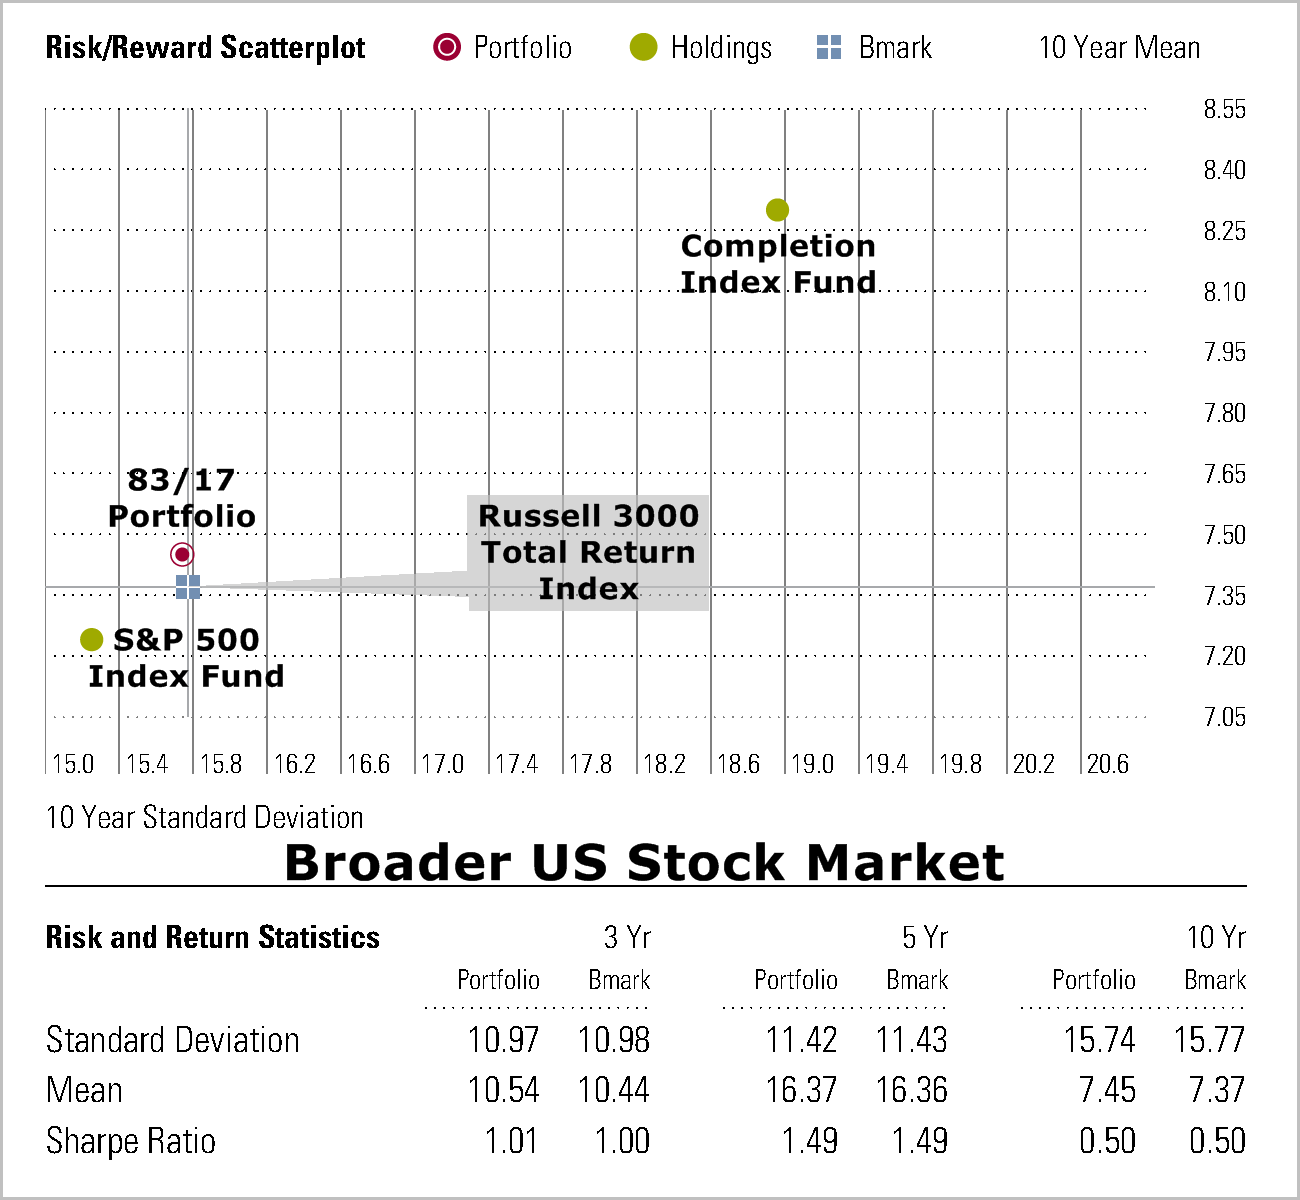
This reference portfolio compares closely to its benchmark as illustrated on the risk/reward scatterplot below.
Enhancing Performance Through Fund Selection
Our hypothetical plan offers four US large-cap stock funds managed more actively than an index. Can any of these funds add value to our otherwise benchmark-neutral portfolio?
Degrees Of Active Management:
Index funds invest passively, “indexing” to some benchmark such as the S&P 500; low cost is everything. Enhanced-passive funds are managed just actively enough to achieve benchmark returns net of fees. Actively managed funds seek to deliver performance in excess of fees against a benchmark designed for their manager’s specific skill set (not necessarily to “beat the market”). They typically cost more because extra thought and effort goes into managing them.
Fund Summary Table:
The following table summarizes some characteristics of our four funds. I have included the S&P 500 index fund for reference. Which funds, if any, would you choose?
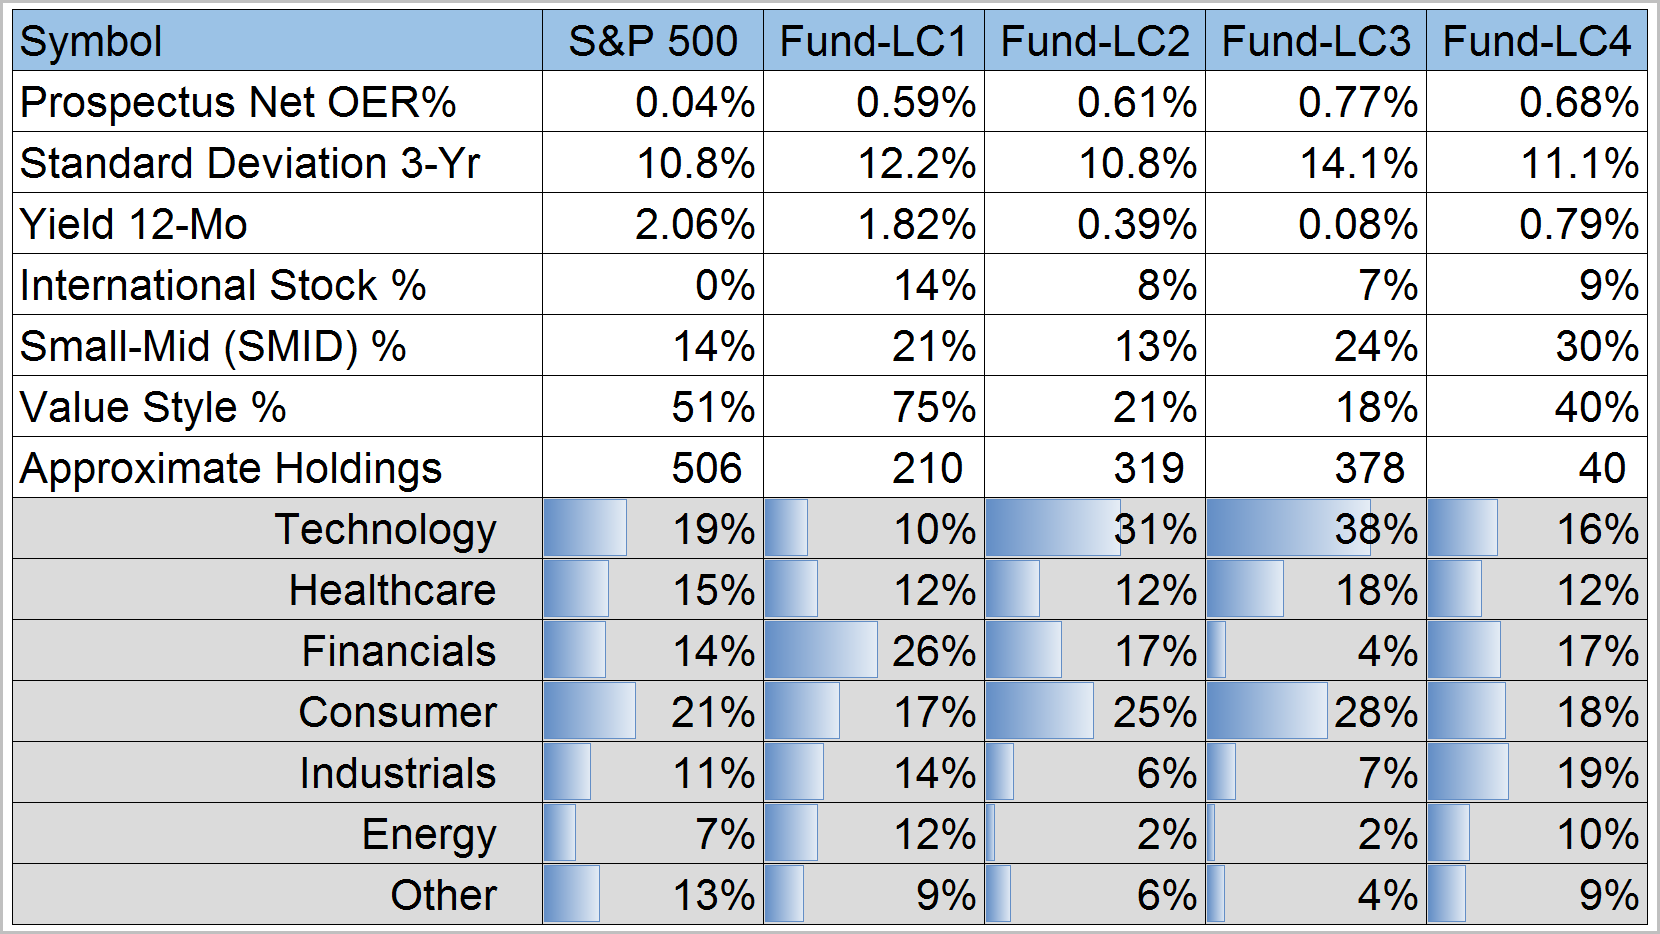
The operating expense ratio (OER) of all four funds is higher than the index, averaging 0.66%. Remember that performance is stated net of operating expenses. The question is not whether a fund is cheaper, but rather does it add overall value to our portfolio. In the absence of value, cost is everything.
“The question is not whether a fund is cheaper, but rather does it add overall value to our portfolio. In the absence of value, cost is everything.”
Growth funds like LC2-4 typically yield below average dividends. Companies generating above average return on investment retain earnings rather than disburse them as dividends. Does it make sense to receive dividends in our retirement account only to reinvest them? (Suggested reading, Understanding Dividends.)
International exposure may be incidental to a US fund’s normal operations. Although our S&P 500 index fund carries no direct international exposure, about 30% of revenues come from abroad. Our four funds also vary across investment style (large cap, small cap, value, growth), and sector concentration. For instance, Fund-LC1 may be suitable when tilting toward value and increasing financial sector exposure.
“Stories about individual investments are relevant only in the absence of all other wisdom.”
Fund characteristics change over time and must be considered by “looking through” general classifications to specific composition. Relying solely on fund names and descriptions is inadequate if not misleading. That’s why I have omitted them. Try it. You’ll find you’ve missed little and gained much insight.
Have you chosen a fund yet? Well, this might help you…
Risk/Reward Scatterplot:
Comparing funds on the risk/reward scatterplot below is enlightening. Moving up the plot represents increasingly higher average annualized return (reward), while left to right measures increasing annualized volatility (risk). At the cross-hairs where 7.4% return meets 15.5% standard deviations lies our broad US stock market benchmark. The ultimate quadrant is above and to the left of the benchmark, where we find Fund-LC2.

The slope of the blue dashed line represents a constant unit change in risk and return. Fund-LC2 has provided more return at lower risk than the benchmark, and all other funds. Fund-LC3 is the only other improvement over the benchmark. But its extra return over LC2 costs disproportionately greater volatility.
Which funds would you choose now?
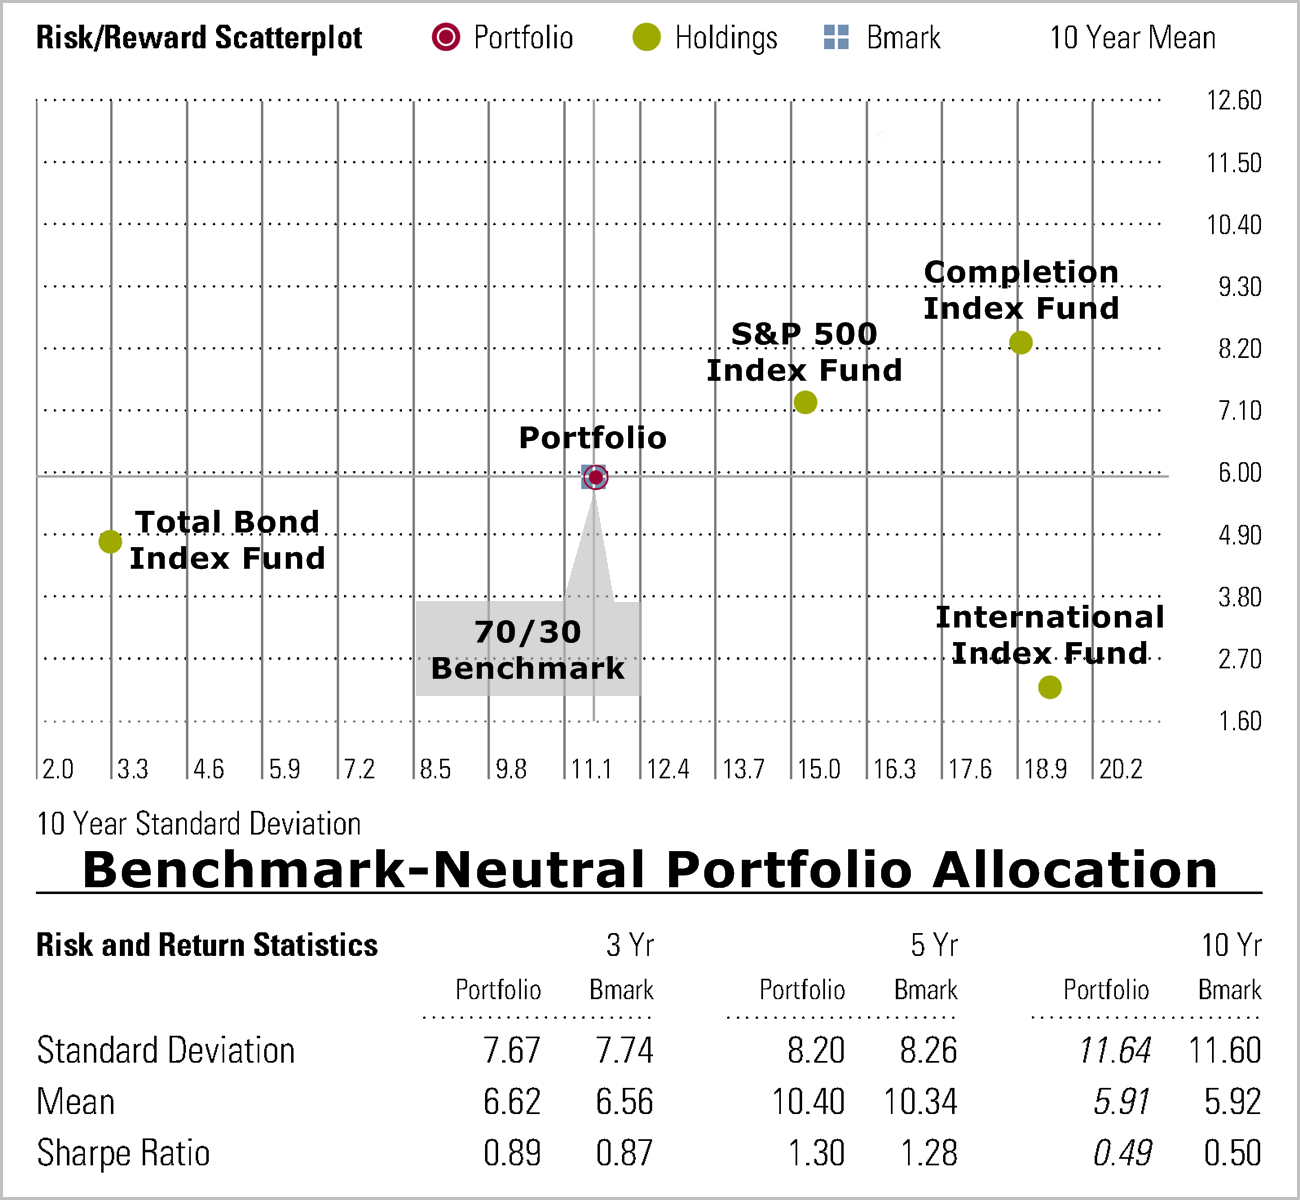
Specific market conditions aside, Fund-LC2 and LC3 have proven to enhance performance relative to our equity benchmark. I used this process described, being mindful of the proper benchmark, to select two more funds: SMID and international stock fund-2.
An Alternate Portfolio Allocation
How do we incorporate these four extra funds into our benchmark-neutral portfolio? International fund-2 borrows one third from the 21% allocated to the international index. The three US funds borrow one quarter from the 49% allocated to the total US stock market via two funds which I reduced proportionately.
To a first approximation, the holdings and allocation of our completed alternate portfolio are:
-
20% Bond market index fund, “Bond-B”
10% Bond-A (per part-1 of this series)
30% S&P 500 index fund
06% Completion index fund
05% Fund-LC2
05% Fund-LC3
03% SMID fund
14% International index fund
07% International fund 2
The next risk/reward scatterplot compares the two portfolios side by side. Over the past ten years, our alternate portfolio generated on average 0.56% more in annualized return, net of fees, at no cost to volatility.
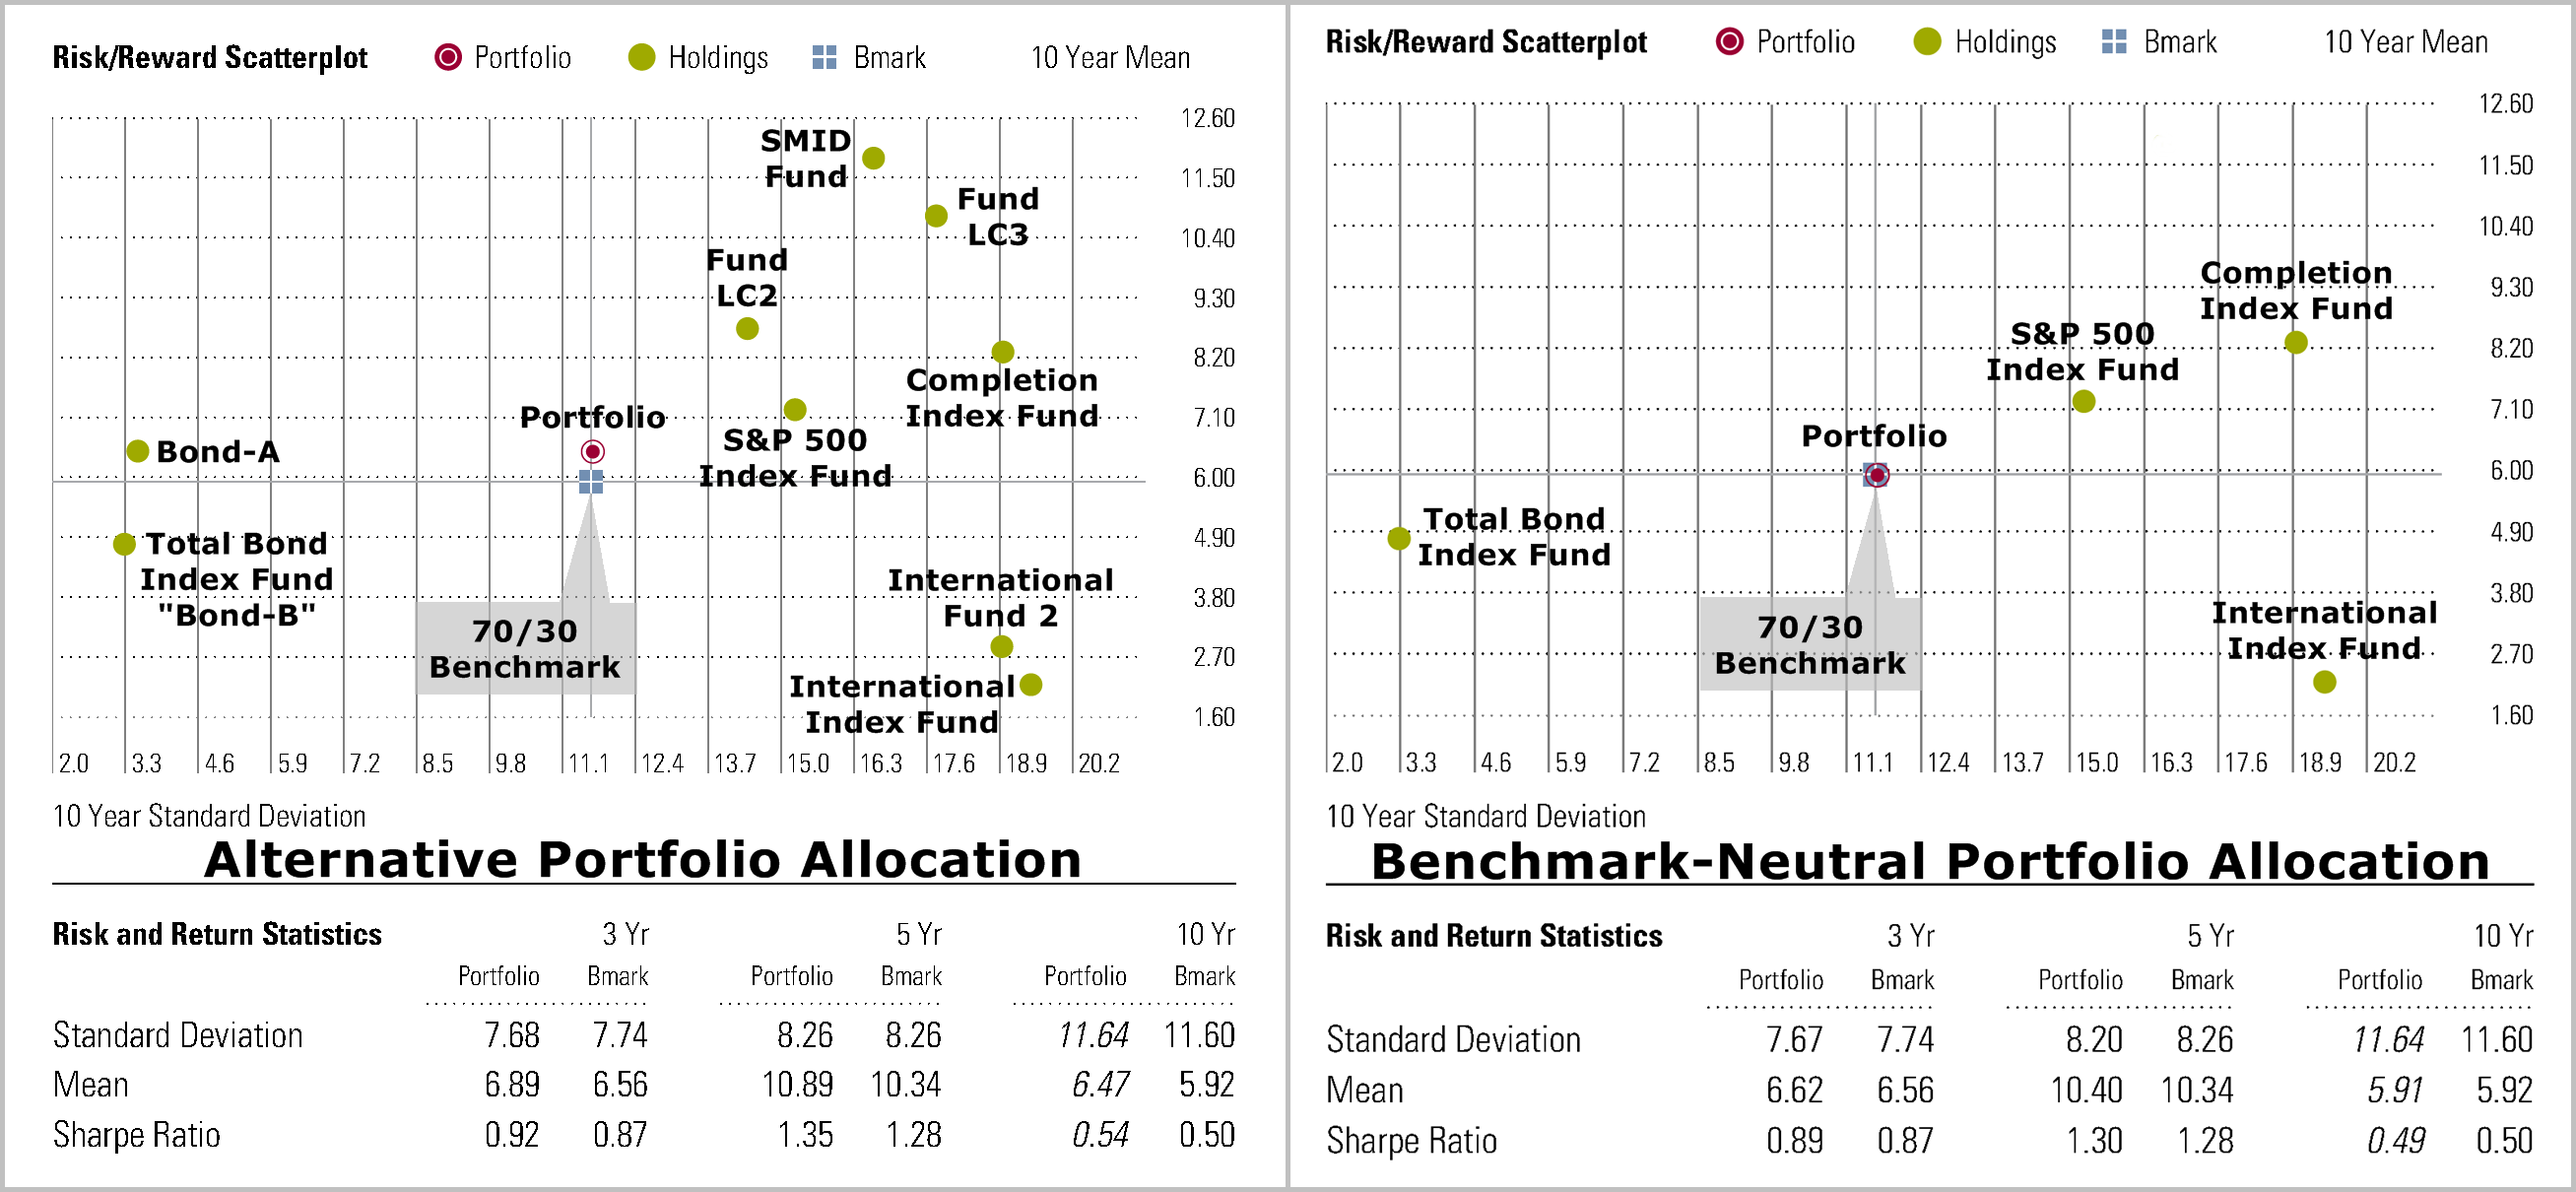
Our benchmark-neutral portfolio provides a reference point from which we can design improvement. We can adjust allocations based on our best-guess of future market trends, like tilting between stocks and bonds, US and international, small cap and large, between sectors, etc.
Name That Chicken!
I am often asked, “So, name some funds you own in your portfolios.” The next time you’re at the supermarket, ask your butcher, “So, name the chickens lying in your freezer.” What matters is the process which faithfully brings chicken to the kitchen table as part of a balanced diet, not the chicken’s name.
“Next time you’re at the supermarket, ask your butcher to name the chickens lying in the freezer.”
Stories about individual investments are relevant only in the absence of all other wisdom. What is important is how each security plays in harmony with the rest of your portfolio team, and the creative process which gets you there. That’s what we do at Coherent.
Warm regards,
Sargon Zia, CFA
November 29, 2016
You are welcome to comment!
Recommended reading:
Managing Your 401k Part 1
Managing Your 401k Part 3
Footnotes:
- Target asset allocation: the percentage of your account allocated to each broad asset class, such as equities, fixed income, commodities, cash, etc. An actively managed portfolio may adjust allocations around this target based on market conditions.
- Our benchmark is composed of indices which do not incur real-world expense such as management fees, transaction costs, and other operating expenses which handicap performance. Our benchmark’s performance is for reference purposes only. You cannot directly invest in an index.
- The Russell 3000 Index includes about 3,000 companies, covering about 98% of the US stock market, including small-caps. The S&P Index includes about 500 companies, covering about 80% of the US stock market, excluding small-caps. See also www.ftserussell.com/ and us.spindices.com/.
- For those of us living in the U.S.A., funds investing exclusively outside our country are referred to as ex-US, foreign, or international. For instance, a foreign growth fund or international stock fund would not typically have any significant holdings in U.S. companies. Indices representing international funds often use “ex-US” in their name.
- The information contained herein: (1) is proprietary to Morningstar and/or its information providers; (2) may not be copied, adapted or distributed; and (3) is not warranted to be accurate, complete or timely. Neither Morningstar nor its information providers are responsible for any investment decisions, damages or losses arising from any use of this information or any information provided in conjunction with it. This report is for information purposes only, and should not be considered a solicitation to buy or sell any security. Past performance is no guarantee of future results.
CONTACT US FOR A COMPLIMENTARY CALL
We look forward to discussing your unique financial goals and personal values!
GET STARTED