Earnings Insight August 2016
August 17, 2016
On the verge of a seventh consecutive quarter of earnings contraction, earnings seasons have felt like unending episodes of disappointment. When will earnings and sales growth resume once again? Finally, there have been some believable signs of improvement, but the markets may already have priced this in.
For nearly two years we have been commenting extensively on this earnings drought in both Earnings Insight1 and Manager’s Letter articles. We want to bypass the minutia to capture the essence of earnings season by answering three high-level, questions:
- What are the market’s expectations for growth?
- Are these expectations grounded in a reasonable and rational basis?
- How much of these expectations are already priced into the market?
The answers to the first two questions are incomplete without addressing the third, key question. So, as our friends down in Rio would say, let’s “peel the pineapple!”
“At current levels the market is paying above average prices for projected sales growth and margins that must shatter 15-year records.”
The Market’s Expectations
Owners of common shares are referred to as “residual owners” because they own what is left over from sales after paying all expenses. For example, dividends are distributed from net earnings after bond holders are paid. Forward looking earnings estimates are an important part of earnings season and a significant determinant of the stock market’s long term trend.
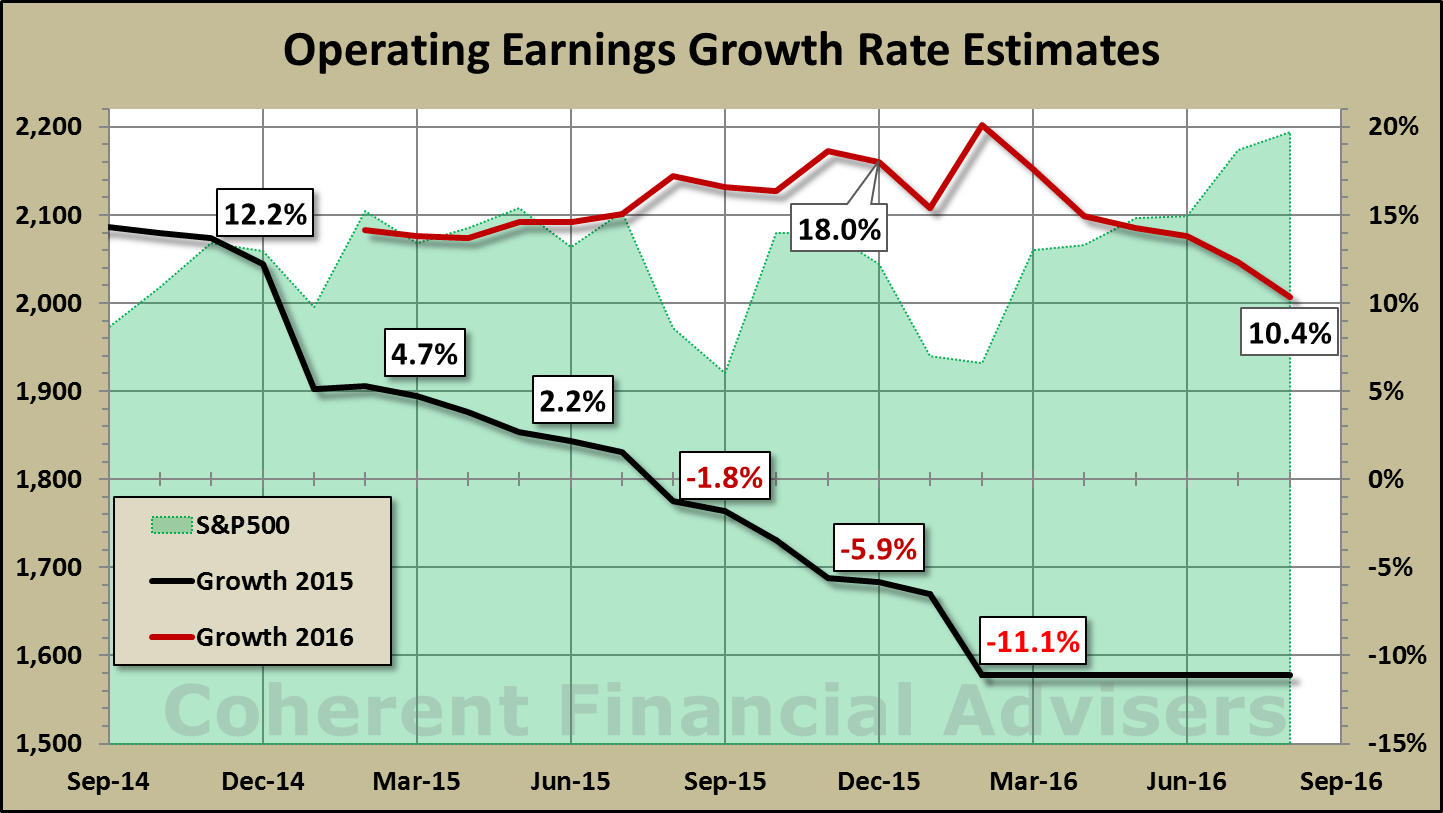
Over-optimism is a disposition the stock market has maintained for more than two years. The S&P 500 Index began 2014 with full year estimates of 13% operating earnings growth. This ended in a humble 5% growth2. Likewise, 2015 rang in estimates of 12% growth, only to wring out an 11% contraction.
As if the third time’s the charm, 2016 full year operating earnings were projected to grow 18% to $126 per share3. After all, 2015’s contraction had set a low-bar! As of our May Earnings Insight article, projections had declined to $115 per share, which we said then was too optimistic. This estimate has now fallen to $111 or 10% growth4.
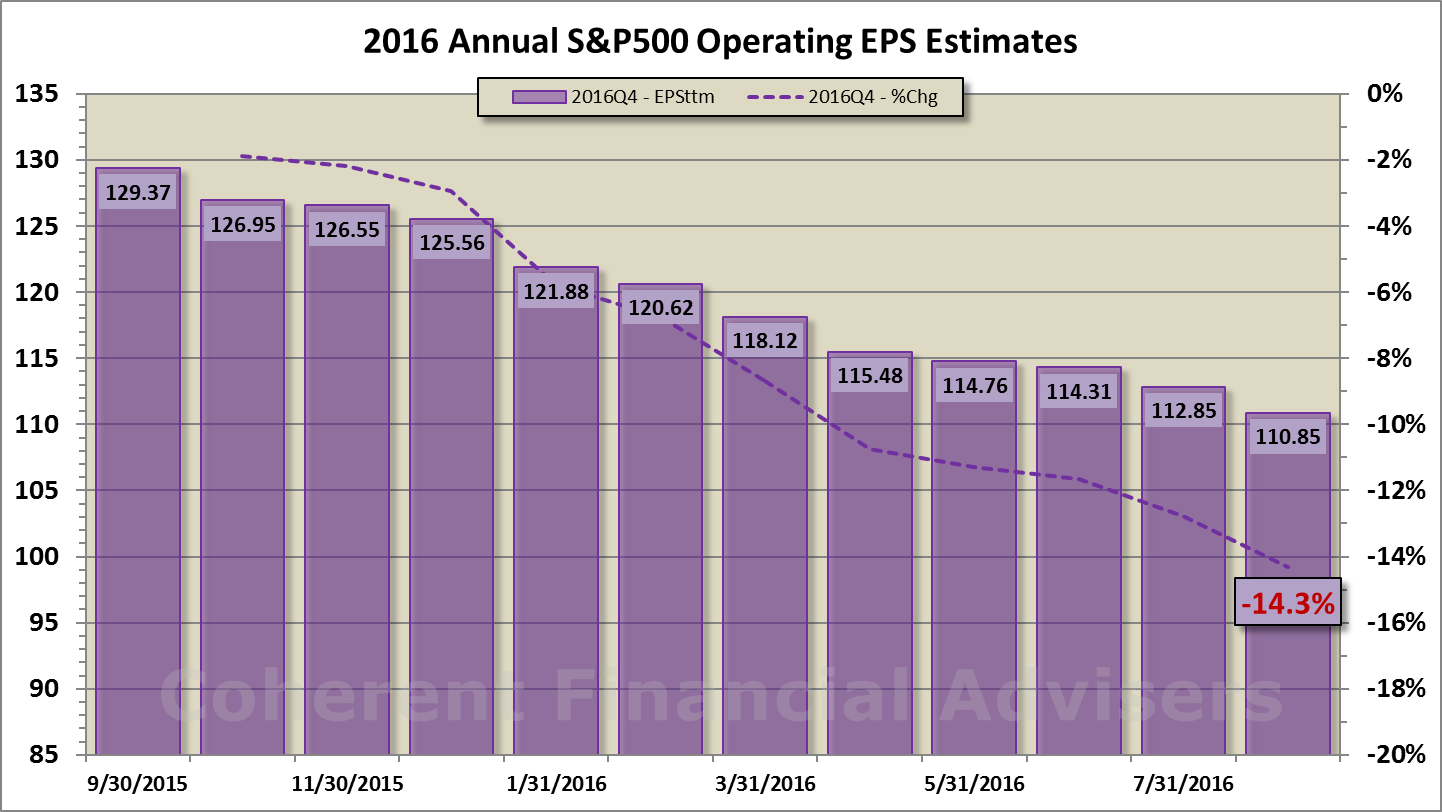
Considering the last two years’ performance, 10% growth is certainly welcomed. But can even this moderated expectation become reality?
Reasonable and Rational Basis
One way to test the quality of estimated earnings growth is to examine its components, sales and margins5, under “all else being equal” conditions. Our reference point for this exercise is the median rate of sales growth and operating margins for the four years from 2012 through 2015, approximately 2.35% and 9.47%, respectively.
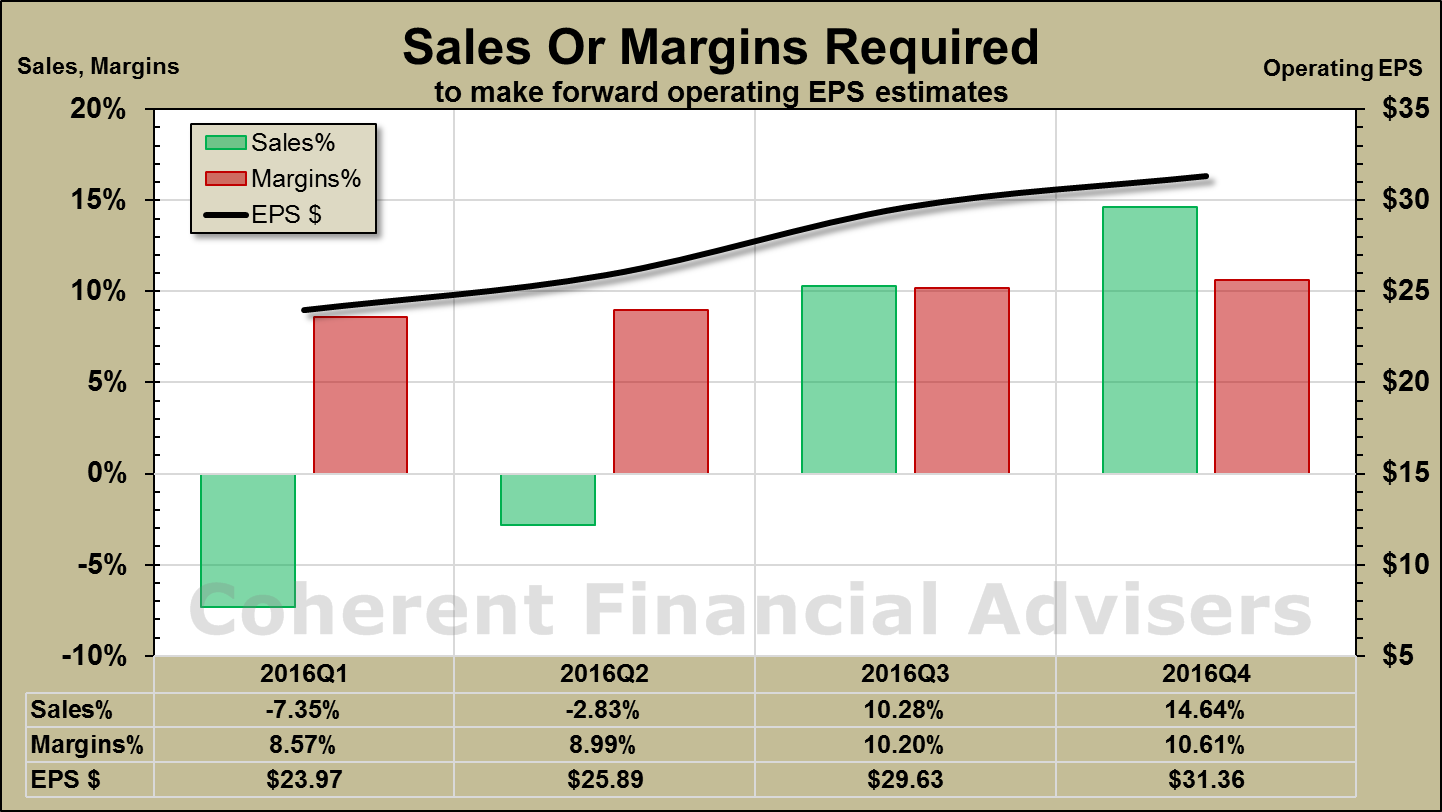
With 90% of S&P 500 Index companies already having reported second quarter earnings, we will consider the results of the first two quarters as a given. That leaves the third and fourth quarters up for grabs.
Sales Required:
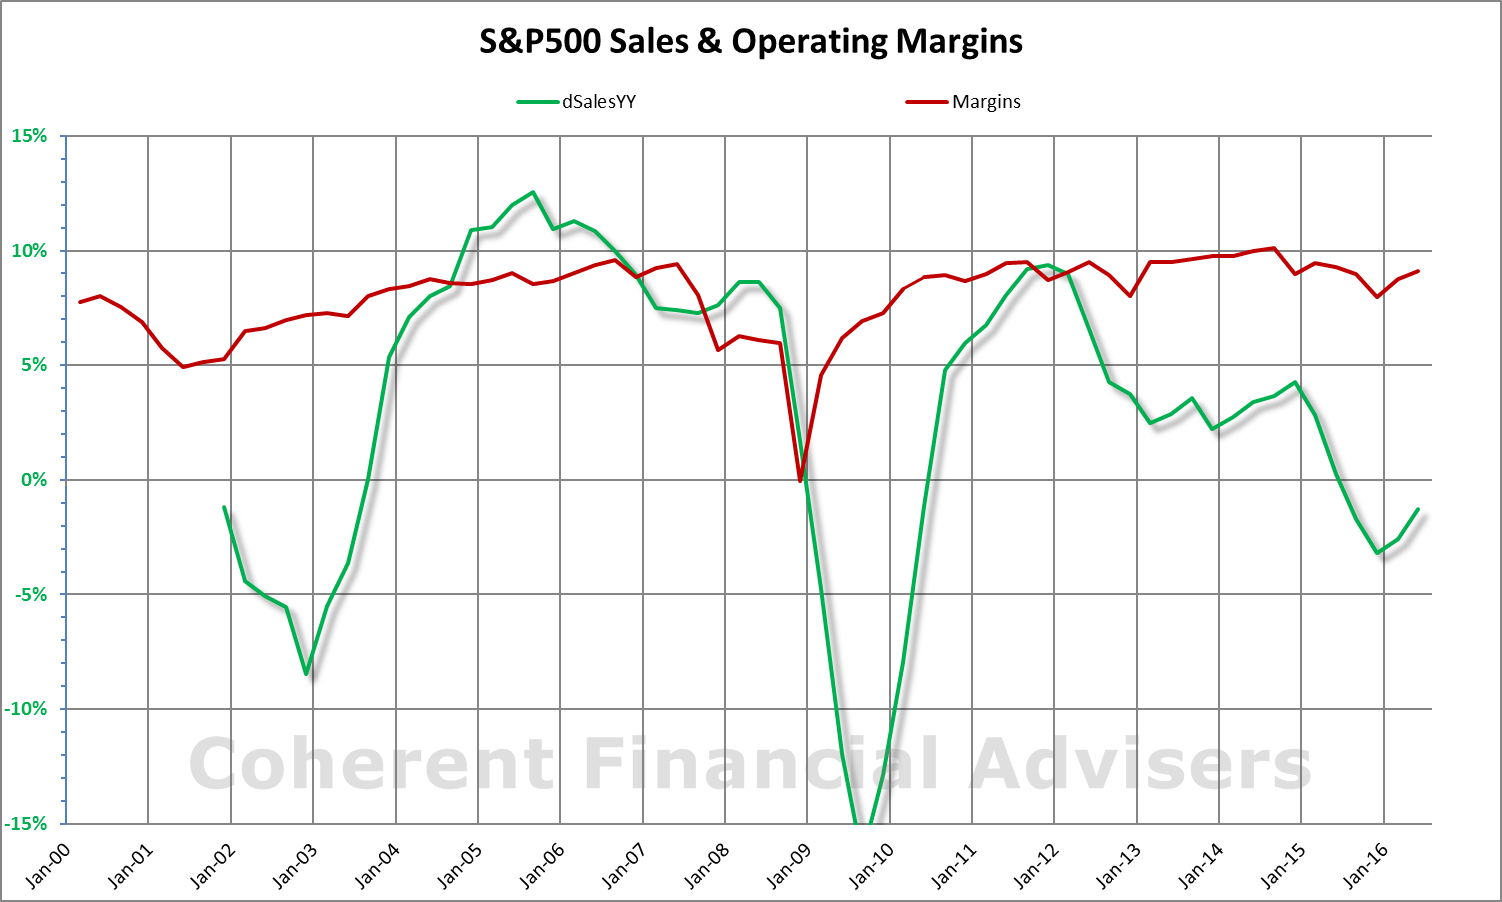
To achieve the current full year operating earnings estimates, third and fourth quarter sales growth would have clock in at 10.3% and 14.6%, respectively, for an average of 12.5%. This assumes a margin rate of 9.47%, which is a 12% increase over the same period last year of 8.47%. In the 60 quarters from 2001 through 2015, we have exceeded 12.5% sales growth one time. Can it happen? Sure. The odds are 1 in 60.
Margins Required:
Increasing margins is like squeezing blood out of a turnip. Assuming sales growth rises to 2.35%, then margins must run at 10.2% and 10.6% to achieve the stated earnings projections. In the 60-quarters from 2001 through 2015, operating margins have averaged 8.0%, and exceeded 10.2% exactly zero times. Can it happen? There is a first time for everything, especially if energy rebounds at relatively low oil prices.
“While sales, margins, and earnings are bound by the physical laws of nature, what people are willing to pay for them is not.”
Achieving the current moderated growth expectations for 2016 may be a reach in the time remaining. Breaking out of the earnings recession by year end is a very real probability.
Priced Into The Market
Whether growth expectations will fuel the S&P 500 Index uptrend depends on how much growth is already reflected in current index price levels. One measure of this is the forward price/earnings or “PE” ratio, the price the market is paying for each dollar of future projected earnings.
The PE ratio is analogous to the dollars per square foot price measure of homes. Keep in mind that monetary inflation exists both in the price per share and earnings per share figures. So, paying more for the same dollar of earnings is a form of stock market inflation, a cyclical phenomenon caused by supply and demand pressures.
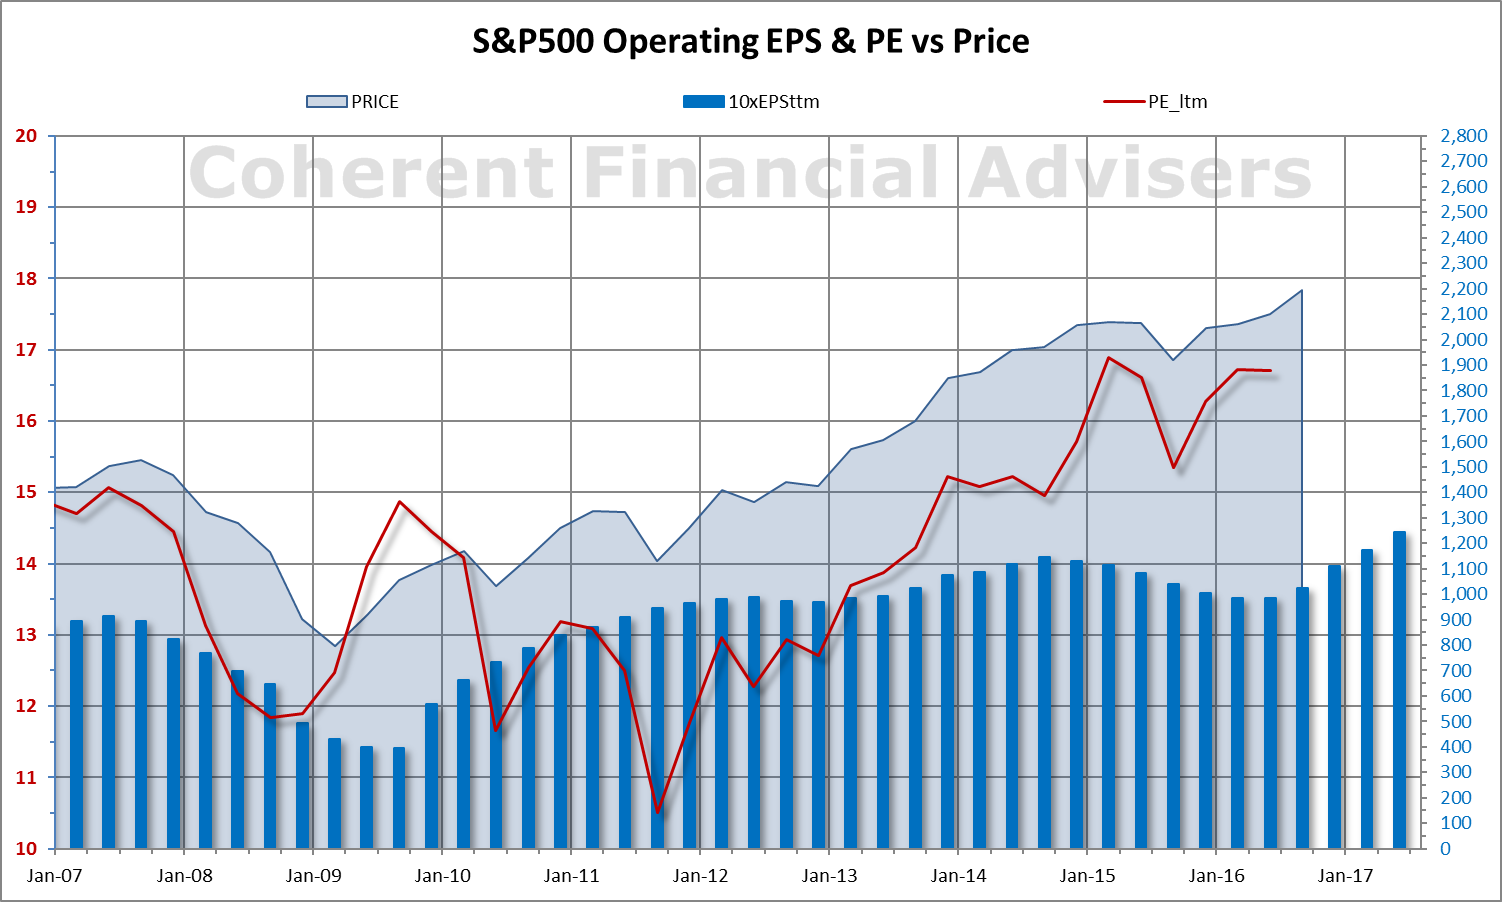
S&P 500 Index price per share is about 16.7 times projected 12-months operating earnings. This forward PE ratio is near its highest level since the 2009 bull market began, and above the 2007 bull market peak of 15. At current levels the market is paying above average prices for projected sales growth and margins that must shatter 15-year records. Some would say that future growth has been priced in, and then some.
Being With The Monkey
Current second quarter operating earnings estimates call for about a negative 1% growth making this the seventh consecutive quarter of earnings contraction. Both sales and earnings are projected to begin expanding by year end. However, current price levels in the S&P 500 Index may already be pricing in projected growth, and in a rich way. Meanwhile, the 2009 bull market cycle has gotten a bit long in the tooth.
While sales, margins, and earnings are bound by the physical laws of nature, what people are willing to pay for them is not. The PE ratio is the wild card here, and recently it has been wild. Monetary policy is at historically accommodative levels. The stock market’s earnings yield is twice its dividend yield which itself is above the 10-year bond yield. Under these conditions, it is not unreasonable to fathom the market going higher, albeit from a precarious position.
Market fundamentals are a large part of our continuous study here at Coherent. We remain vigilant in the event the market enters a phase of “being with the monkey” – as they would say down in Rio6.
Warm regards,
Sargon Zia, CFA
August 17, 2016
You are welcome to comment!
Published quarterly, Earnings Insight provides an analysis and summary of material trends in company earnings reports as interpreted by the author and Chief Investment Officer of Coherent Financial Advisers.
Footnotes:
- In this Earnings Insight series, we focus on key revenue and earnings trends. Our analysis is based primarily on S&P 500 Index aggregate company earnings results and forward looking estimates. We want to pay attention to real and recurring drivers of company growth, looking past the non-cash and accounting related practices. We have chosen to analyze operating data where possible, rather than the as-reported figures usually cited.
- Data source: S&P Dow Jones Indices, us.spindices.com as of August 11, 2016. Values are rounded for ease of reading. Analysis and interpretation provided by Coherent Financial Advisers, LLC.
- $125.56 per share over a blended $106.40 as of December 31, 2015
- $110.85 per share over an actual 100.45 as of August 11, 2016
- Expenses are typically measured in terms earnings left over from sales. Given sales of $100 per shares, and $92 of expenses, margins would be 8% or $8 per $100 of sales. Increasing margins means decreasing expenses, given a certain level of sales.
- “Being with the monkey” is a Portuguese expression for being bad tempered. See http://rio2016.olympics.com.au/rio-games/the-marvellous-city/portugese-phrases
CONTACT US FOR A COMPLIMENTARY CALL
We look forward to discussing your unique financial goals and personal values!
GET STARTED
 Print PDF