Earnings Insight May 2016
Just over 60% of the companies in the S&P 500 have reported first quarter 2016 earnings as of the end of April. Expectations at this time are for yet another quarter of sales and earnings contraction, with growth not expected to resume until sometime in the second half of this year. Excessive optimism has been a consistent theme for more than a year.
In this Earnings Insight series, we focus on key revenue and earnings trends. Our analysis is based primarily on aggregate forward looking estimates of the S&P 500 Index companies’ revenue and operating earnings1. We want to pay attention to real and recurring drivers of company growth, looking past the non-cash and accounting related practices. Therefore, we have chosen to analyze operating data where possible, rather than as-reported figures usually cited. Numbers are rounded for ease of reading.
Enjoy the video version of this article from our YouTube channel…
Beware Of Lightning In Clouds With Silver Linings
In our previous Earnings Insight article we discussed the “silver lining for 2016.” The further actual 2015 earnings declined, the lower the bar became for 2016 earnings growth. The problem with this particular silver lining is that it has been sewn into a cloud that has potential lightning. The lightning in this case comes from three sources:
- excessively optimistic earnings projections
- excessively optimistic stock market valuation
- excessively optimistic growth rate priced into the market
The signs of over-optimism were present in 2014 as we shared with clients in published presentations and articles, including the Manager’s Letter 2014 Q4.
When Optimism Can Be A Bad Thing
People are generally optimistic about the future. When it comes to the markets, excessive optimism can be a bad thing. The market is a forward-looking mechanism, pricing assets today based on expected future growth, less some margin of safety. The danger is when the market becomes excessively optimistic at the risk of a correction. The stock market is one place where it truly pays to have realistic expectations.
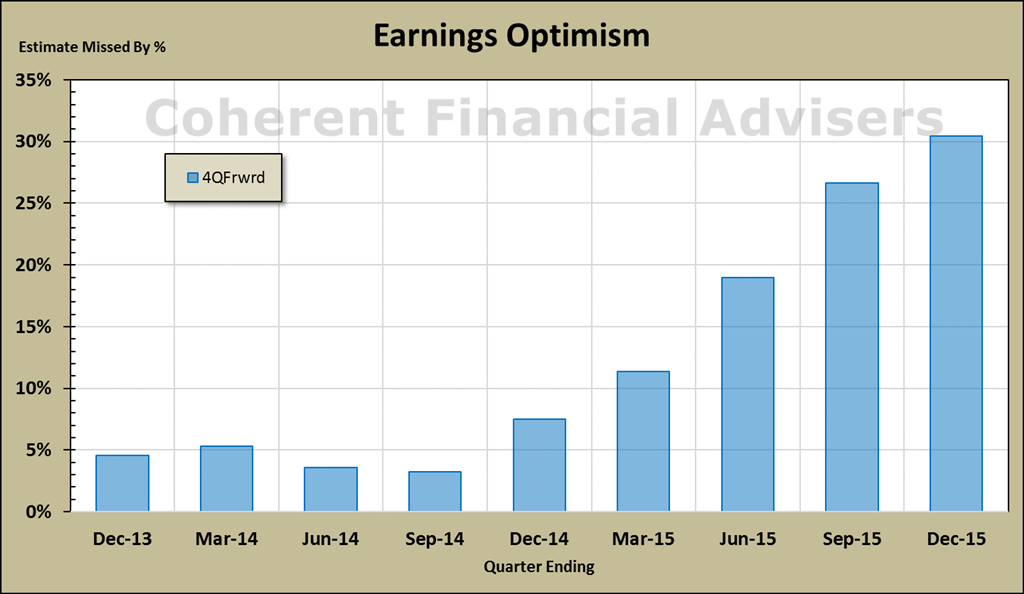
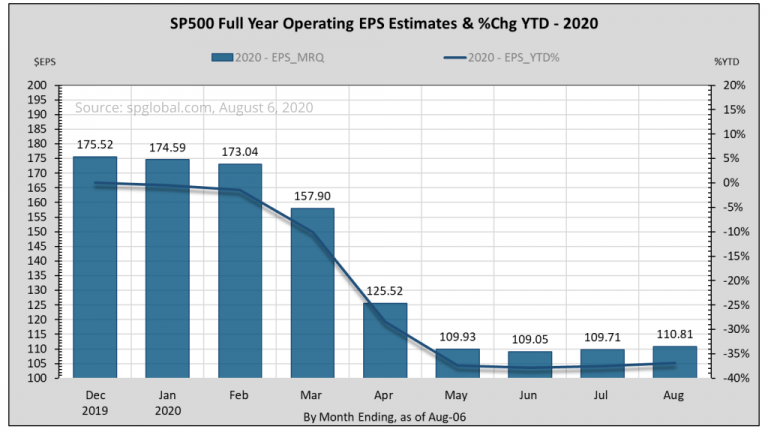
For most of 2014, earnings projections four quarters ahead have been mildly optimistic and quite accurate, averaging less than 5% above actual results. However, for the five quarters since Q4-2014, estimates have overshot at an increasingly alarming rate as seen in figure-1.
“If space abhors a vacuum, the market abhors negative surprises.”
In our previous article, Investor Behavior In Volatile Markets, my colleague, Tom Pietrack, discusses cognitive biases including anchoring, overconfidence, and loss aversion. Recent trends in earnings outlook are a good illustration of the first two biases, too much of which invariably leads to the third – loss aversion.
If space abhors a vacuum, the market abhors negative surprises.
A Grouchy Market Is Indicative Of Over-Valuation
According to FactSet Research Systems2, the market has been punishing earnings misses while not rewarding earnings beating expectations. On average, companies reporting upside surprises for Q1 gained about 0.4% over the two days before and after earnings. In contrast, companies reporting downside surprises averaged a 2.9% loss.
“When the market disproportionately punishes downside earnings surprises, it is indicative of over-valuation.”
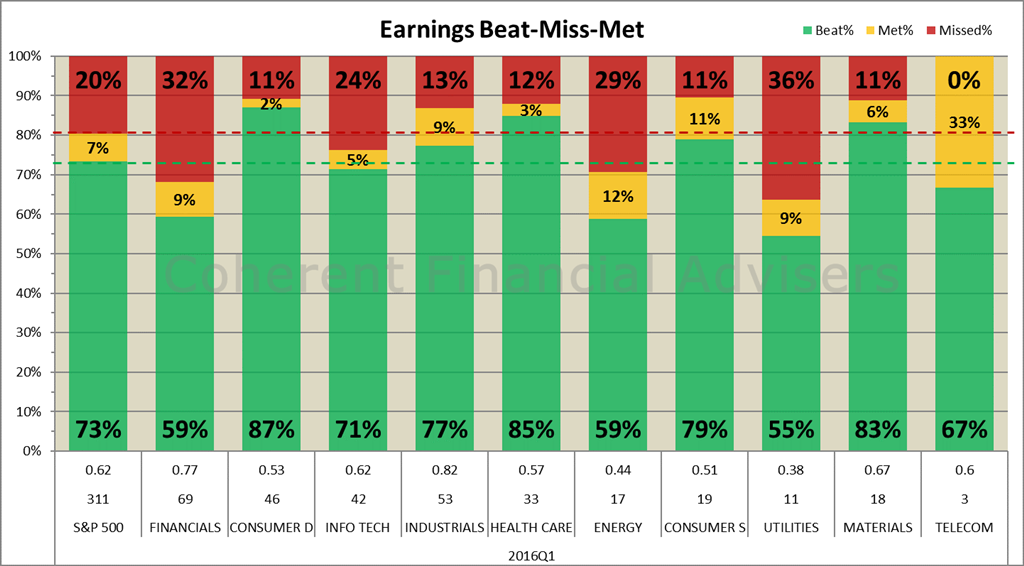
Figure-2 shows the ratio of earnings “beats and misses” by sector compared with the overall S&P. (Note that this is a misnomer: earnings don’t miss estimates any more than targets miss arrows.) Keep in mind that with 40% of S&P companies still to report earnings, beats generally run above trend before all the results are in.
When the market disproportionately punishes downside earnings surprises, it is indicative of over-valuation. By my calculations, the forward S&P aggregate price-earnings (P/E) ratio has been running above its longer term average since the fourth quarter of 2014. Not surprisingly, this coincides with the optimistic earnings estimates in figure-1, and with the start of this market’s correction. Forward operating P/E is currently near 17 which is in the 70th-percentile measured since 1999. To put this in perspective, forward P/E since Q4 2014 has been trending above the peak in 2007.
Perhaps a good example of expensive valuation is Netflix (NASDAQ: NFLX). In the most recent four quarters, as-reported earnings per share have consistently contracted at an average rate of 47%. Meanwhile, sales have been growing consistently between 23% and 27% per quarter for at least two years. But in terms of P/E, Netflix is priced at more than 19-times the S&P 500 Index and that’s after declining 32% from its December highs.
Imagine buying the S&P Index at 39,000, which today is trading at about 2,050! Is it a wonder that Netflix dropped 13% after beating estimates by more than 60%?
Repeat: Earnings Estimates Are Still High
Again in our previous Earnings Insight article we showed that 2015 actual earnings came in at 23% below the estimates at the beginning of that year. In other words, the estimates were 30% off the mark. I would call that excessively optimistic. Similarly, 2016 full-year estimates have dropped almost 11% in just seven months.
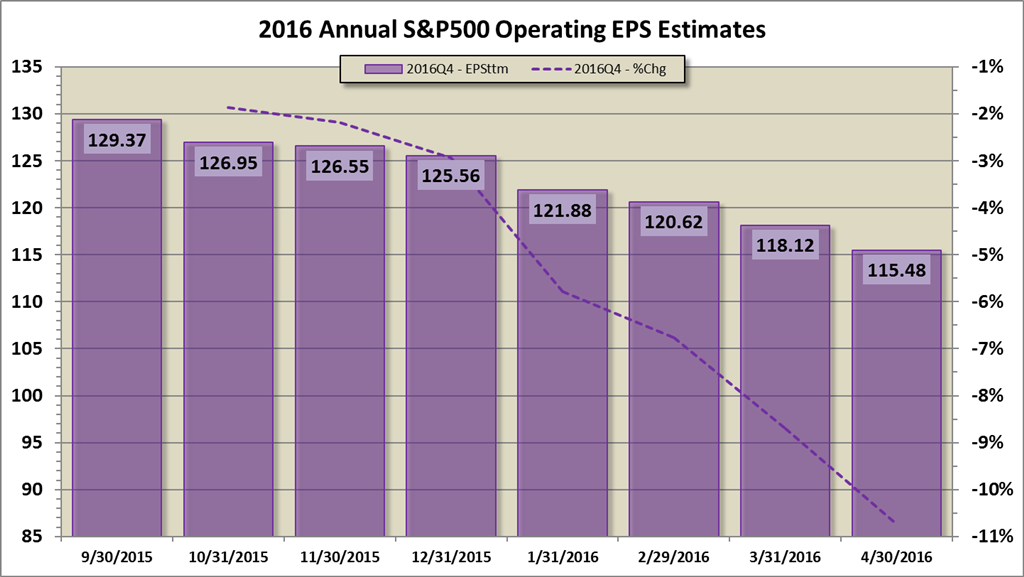
With the S&P near all-time highs, and forward valuations above average, the last thing the market needs is optimistic earnings estimates. Assuming current earnings estimates were to materialize, then 2016 operating earnings growth would clock in at 15% above prior year. Is it possible for the market to generate $115 per share by year’s end?
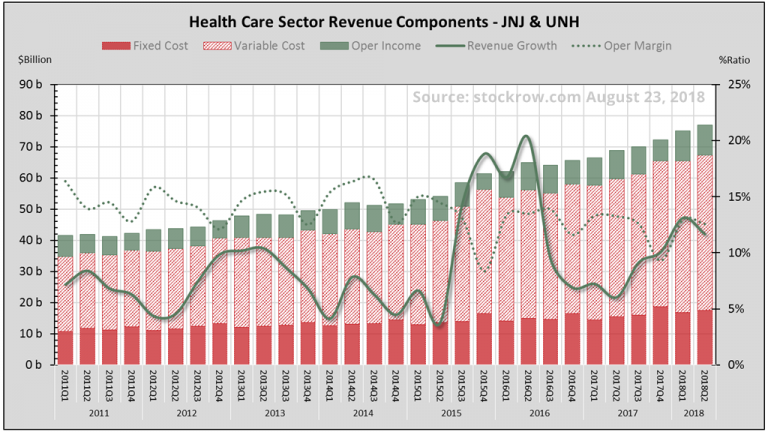
Earnings don’t grow on trees any more than dividends are free. They are the residual of revenue generated after paying expenses. For the S&P to earn $115 by year-end, either sales have to increase or margins have to expand (margin is a way to measure expenses by relating earnings to sales). This is possible, if not a stretch.
“The danger is when the market becomes excessively optimistic at the risk of a correction. The stock market is one place where it truly pays to have realistic expectations.”
For the S&P to earn $115 given recent trends in margins, sales would have to grow by an average of 9% per quarter. Although this happened in 2004 and 2011, a more likely reversion to the mean calls for 2.2% trend growth. Alternately, if sales were to return to their trend growth of 2.2%, margins would have to expand to 10% on average per quarter, the highest level in over 20 years.
The reality is that sales growth is well below trend and margins are contracting. Meanwhile, valuations are relatively high, and there is dearth of leading stocks from more traditionally growth sectors rising out of the ashes to start new up-trends.
“IF” Was Planted But Nothing Grew
Even after all this, if sales were to return to or above trend, and if margins were to expand to absolute maximum levels, the projected 2016 earnings growth rate may already be fully priced into the S&P. My mother used to say, “IF was planted, but nothing grew.”
There are certain key underlying principles we practice in all that we do at Coherent. We aim to provide our clients with our own original analysis and opinion about the markets, not regurgitated media fodder. We strive to act with the transparency and accountability deserving of our clients.
Therefore, we post our opinions here on this site with the intent that if every article is printed and bound together, the thought process will read as if one book. We encourage you to review our past articles for a deeper insight into the markets.
Warm regards,
Sargon Zia, CFA
May 5, 2016
You are welcome to comment!
Published quarterly, Earnings Insight provides an analysis and summary of material trends in company earnings reports as interpreted by the author and Chief Investment Officer of Coherent Financial Advisers.
Footnotes:
- S&P Dow Jones Indices, us.spindices.com as of April 30, 2016
- Factset Research Systems, www.factset.com, April 29, 2016