Earnings Insight March 2016
Earnings season for the first quarter of this year is virtually complete. We are witnessing consecutive quarters of earnings contraction not seen since 2009. The hope that revenue and earnings growth would have resumed by now has been postponed until the second half of the year.
In this Earnings Insight series, we focus on key revenue and earnings trends. Our analysis is based primarily on S&P 500 Index aggregate company earnings results and forward looking estimates2. We want to pay attention to real and recurring drivers of company growth, looking past the non-cash and accounting related practices. We have chosen to analyze operating data where possible, rather than the as-reported figures usually cited.
Numbers are rounded for ease of reading.
Why Are Earnings Growth Estimates Important?
The market is forward-looking. It prices today what it believes future growth will bring, less some margin of safety for risk. The price of the S&P 500 Index at any time is a reflection of the of future growth which investors collective estimate. Estimates are all we have when looking to the future. The danger is when the market becomes overly-optimistic at the risk of a correction later on.
In contrast, actual earnings are backward looking, but they do give us some valuable information. We can observe trends and trend changes, such as the rate at which earnings are rising. Actual earnings provide a basis on which to gage estimates of future growth. Forward looking data influences current market prices.
As companies report earnings each quarter, full year’s estimates become a blend of actual and estimated earnings. For instance, companies had already reported first quarter numbers by June 2015. Therefore, full year 2015 estimates at that point in time were a blend of first quarter actual earnings, and subsequent 3-quarter estimated earnings.
Wrapping up 2015 Earnings
Fourth quarter 2015 earnings numbers for S&P 500 Index companies are virtually all in. What analysts estimated at the beginning of 2015 diverged greatly from what the market actually delivered by year end. You can see in figure-1 how estimates changed each month as the year progressed. The earnings estimates were revised downward in every month for the entire year.
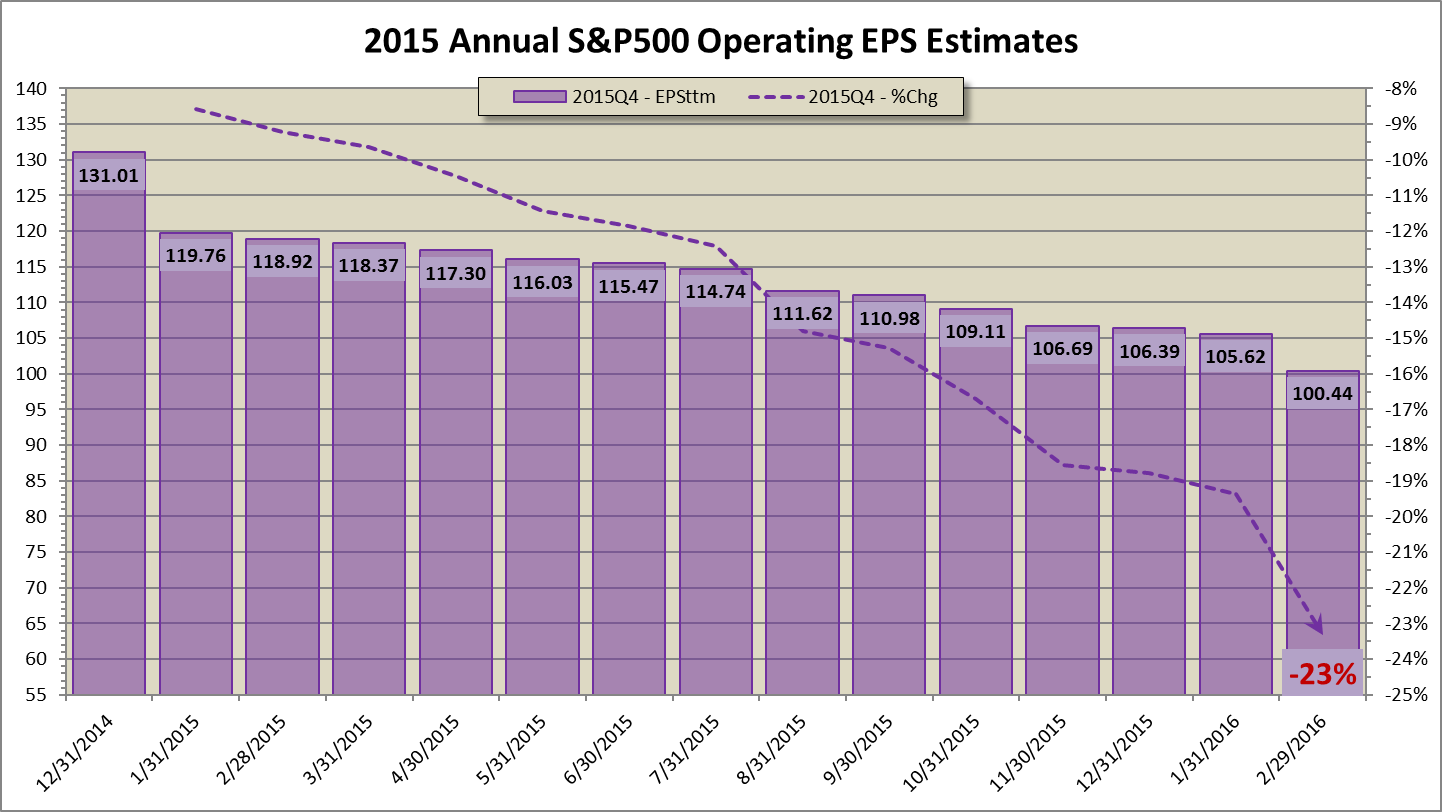
Full year 2015 S&P operating earnings estimates were $131 per share at the beginning of that year. Realized earnings now stand near $100 per share, a 23% decline from original estimates.
When we compare one year’s earnings with those from the prior year, we switch from speaking in terms of absolute dollars to a relative growth rate. This is what you see in figure-2. Compared with 2014, last year’s earnings contracted 11%, a negative growth rate. The original estimates were for 12% positive growth. The signs of over-optimism were present in 2014 as we shared with clients in published presentations and articles, including the Manager’s Letter 2014 Q4.
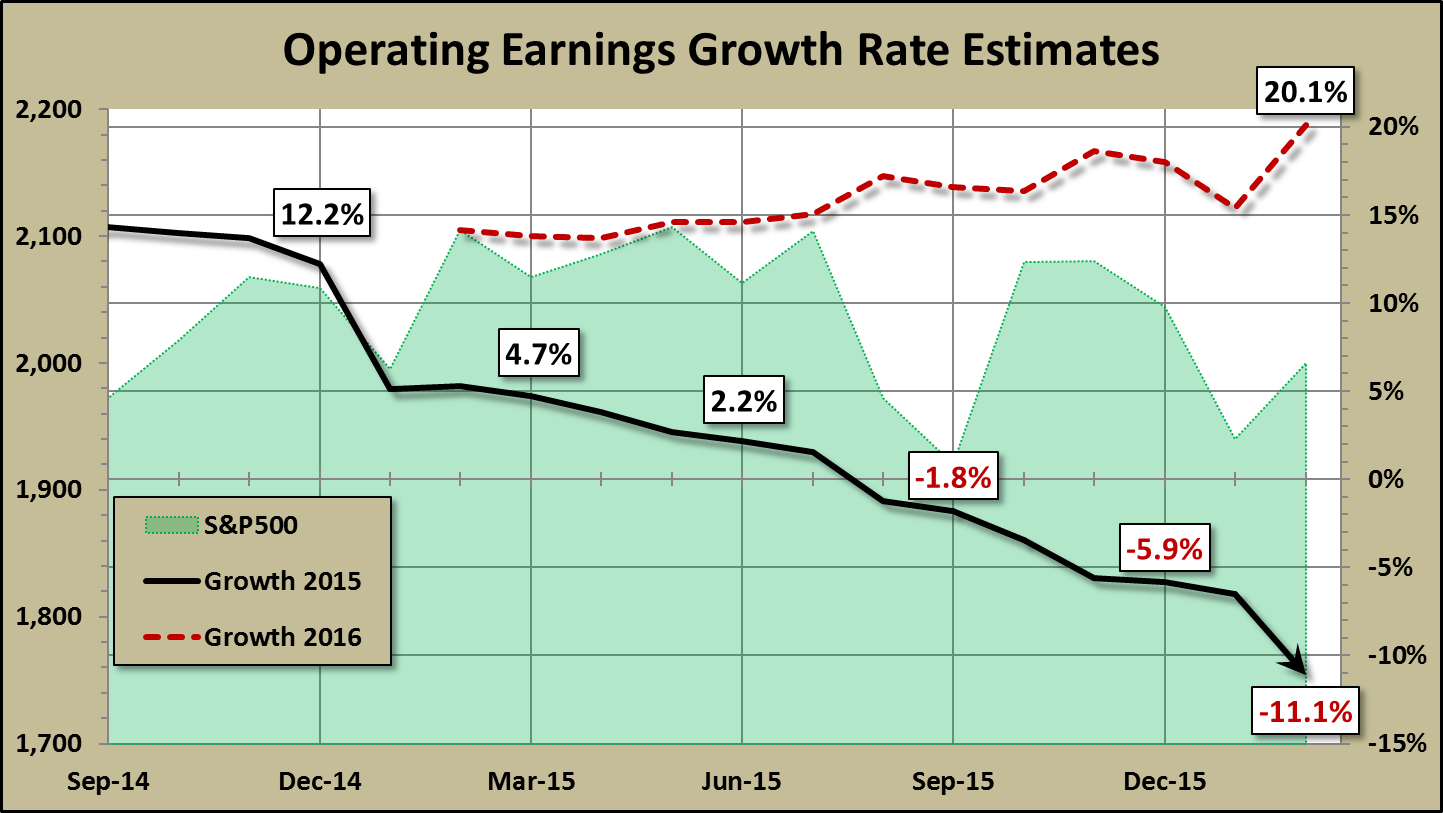
The red line is a record of 2016 operating earnings growth estimates. We will discuss this more later. The hope is that we are not being overly optimistic…again.
The Silver Lining For 2016
We began receiving estimates for 2016 earnings early last year. These 2016 growth estimates had been based on 2015 blended earnings, until now. This is like trying to hit a moving target from atop a speeding vehicle over rough terrain in heavy fog – an unenviable task.
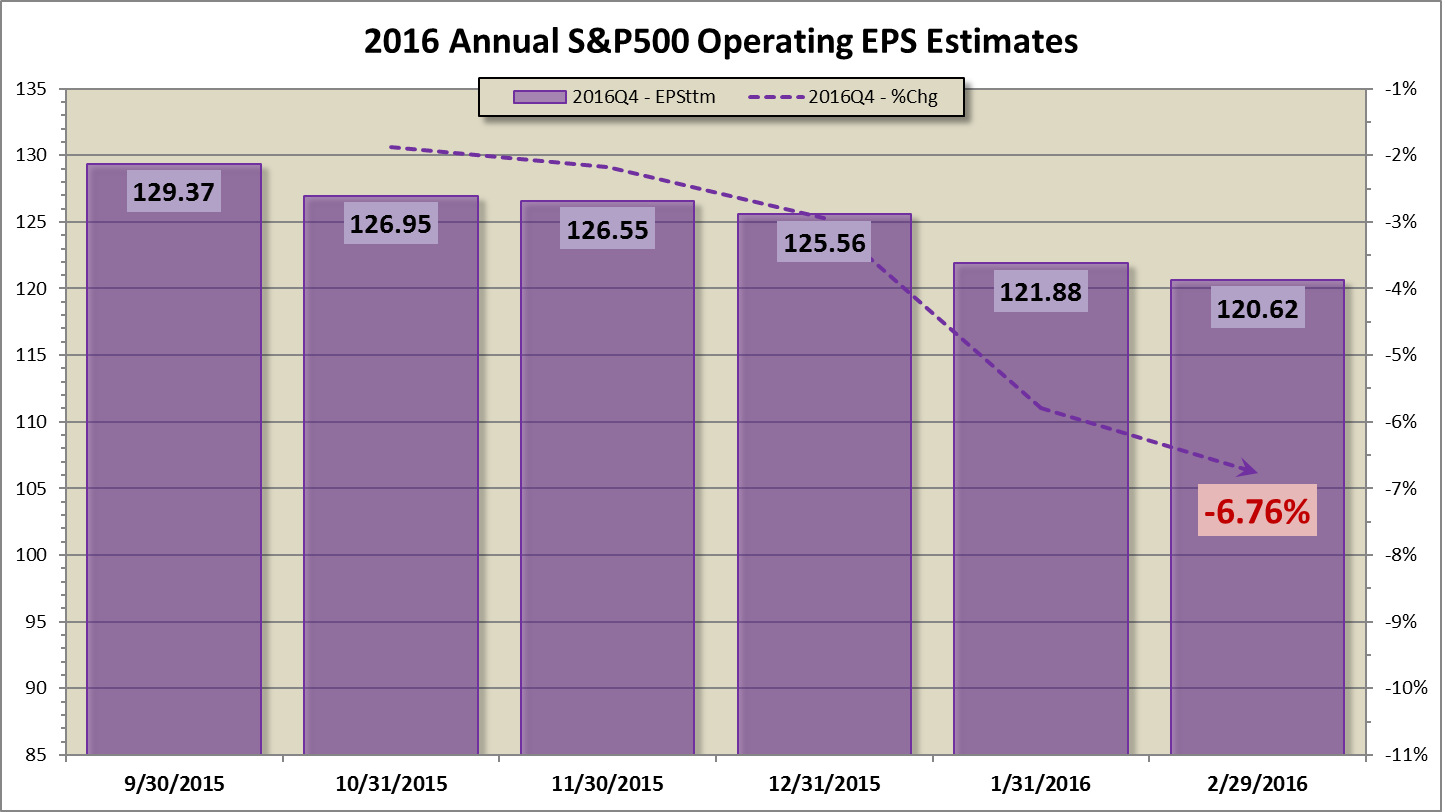
Full year 2016 earnings estimates have been declining for the past six months as can be seen in figure-3. Meanwhile, 2015 blended earnings were declining even faster. This explains why the red line in figure-2 has been rising, indicating that the 2016 earnings growth rate is rising relative to 2015 earnings.
“This is the silver lining. The further actual 2015 earnings declined, the lower the bar became for realizing a higher 2016 earnings growth rate. It’s not rocket science. “
Kicking-off 2016 With Negative Guidance
As companies report fourth quarter earnings, some have provided guidance for the first quarter of this year. Operating earnings estimates for Q1 are down 11% since the beginning of Q4 (figure-4, blue). Estimates are down 7.5% from the start of this year alone. This downward revision just two months into a quarter is more than twice the average over the past ten years, according to Factset Research Systems1.
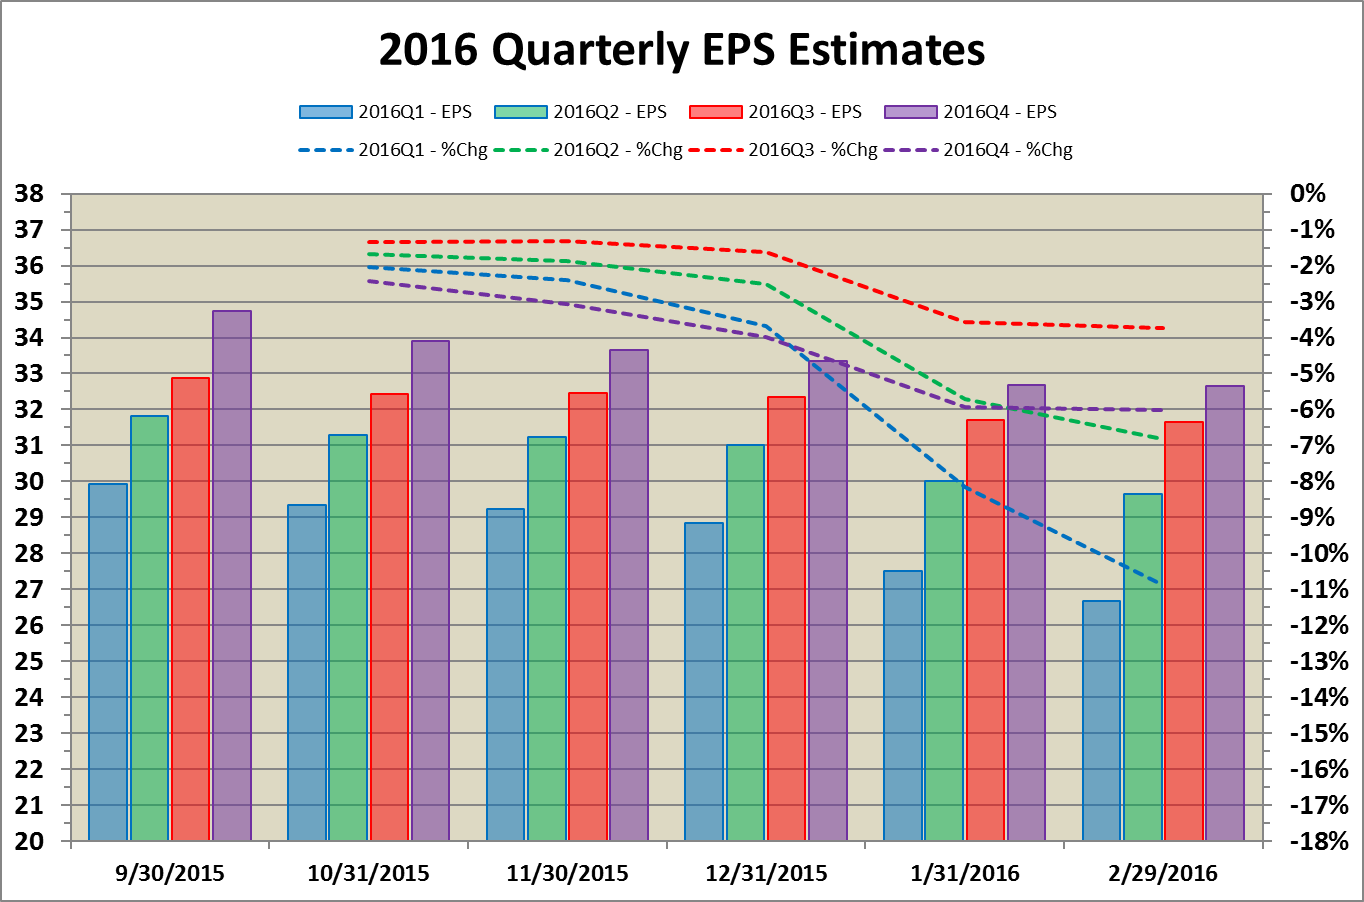
According to Factset, 91 S&P companies have issued negative guidance compared with 24-positive. Earnings “surprises” are below the 5-year average. All ten S&P sectors have seen declines in earnings growth estimates. The largest contributors have been the Energy and Materials sectors.
People are generally optimistic about the future, and markets are made up of people. The trend in figure-4 is typical of future quarterly estimates being more optimistic than the near quarter. Each bar shows the dollar estimate for one of four quarters. Together, these four quarter estimates add up to the full year 2016 estimate in figure-3. The dashed lines measure the comparative change from quarter-end September.
Revenue Is A Primary Driver Of Earnings Growth
Much of the earnings growth in this recovery has been due to improving margins (tightening expenses). I’ve detailed this trend in many articles including Coherent Investor February 2016 and the Manager’s Letter 2015 Q2, and in live presentations to our clients. A healthier earnings trend is for a company to grow sales. In recent quarters, both sales and margins have contracted, leaving earnings nowhere to go but downward.
Sales growth since the 2009 recession has been tepid, especially when compared with previous recoveries. Nominal Gross Domestic Product (GDP) is one indication company revenue growth. Both include inflation, albeit revenue is far more volatile. Note that about 30% of S&P 500 company sales come from outside the U.S.
The relatively flat area after 2009 in figure-5 averages about 3.7% nominal GDP through October 2015. Over the same period, year-over-year sales growth in S&P companies has averaged about 5.7%, before the recent contraction. The chart comes from the Federal Reserve Bank of St. Louis. The source of the data is The US. Bureau of Economic Analysis.
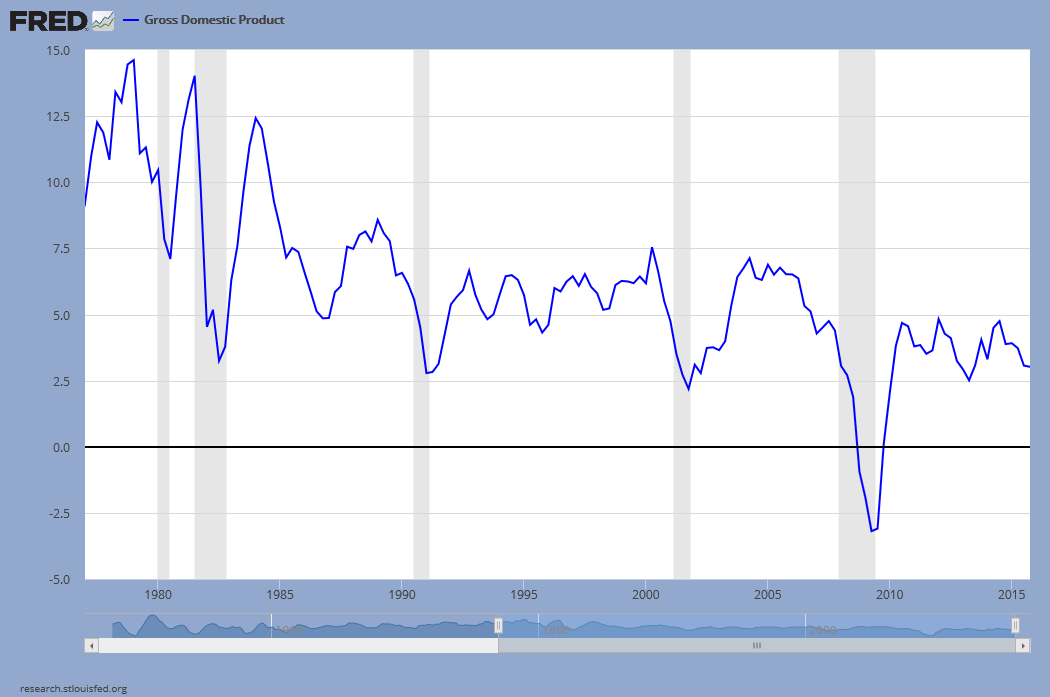
According to FactSet Economic Estimates, “Real (year-over-year) GDP growth in the U.S. is projected to be 2.5% in 2016, which would be consistent with GDP growth of the past few years. Companies in the S&P 500 in aggregate generate about 70% of sales…from the U.S.”
Add the recent 2% PCE inflation to real 2.5% GDP and you get approximately 4.5% nominal growth for 2016. This gives us some target, as well as hope, for S&P 500 sales growth this year.
Comparing Declines Across Four Major Stock Markets
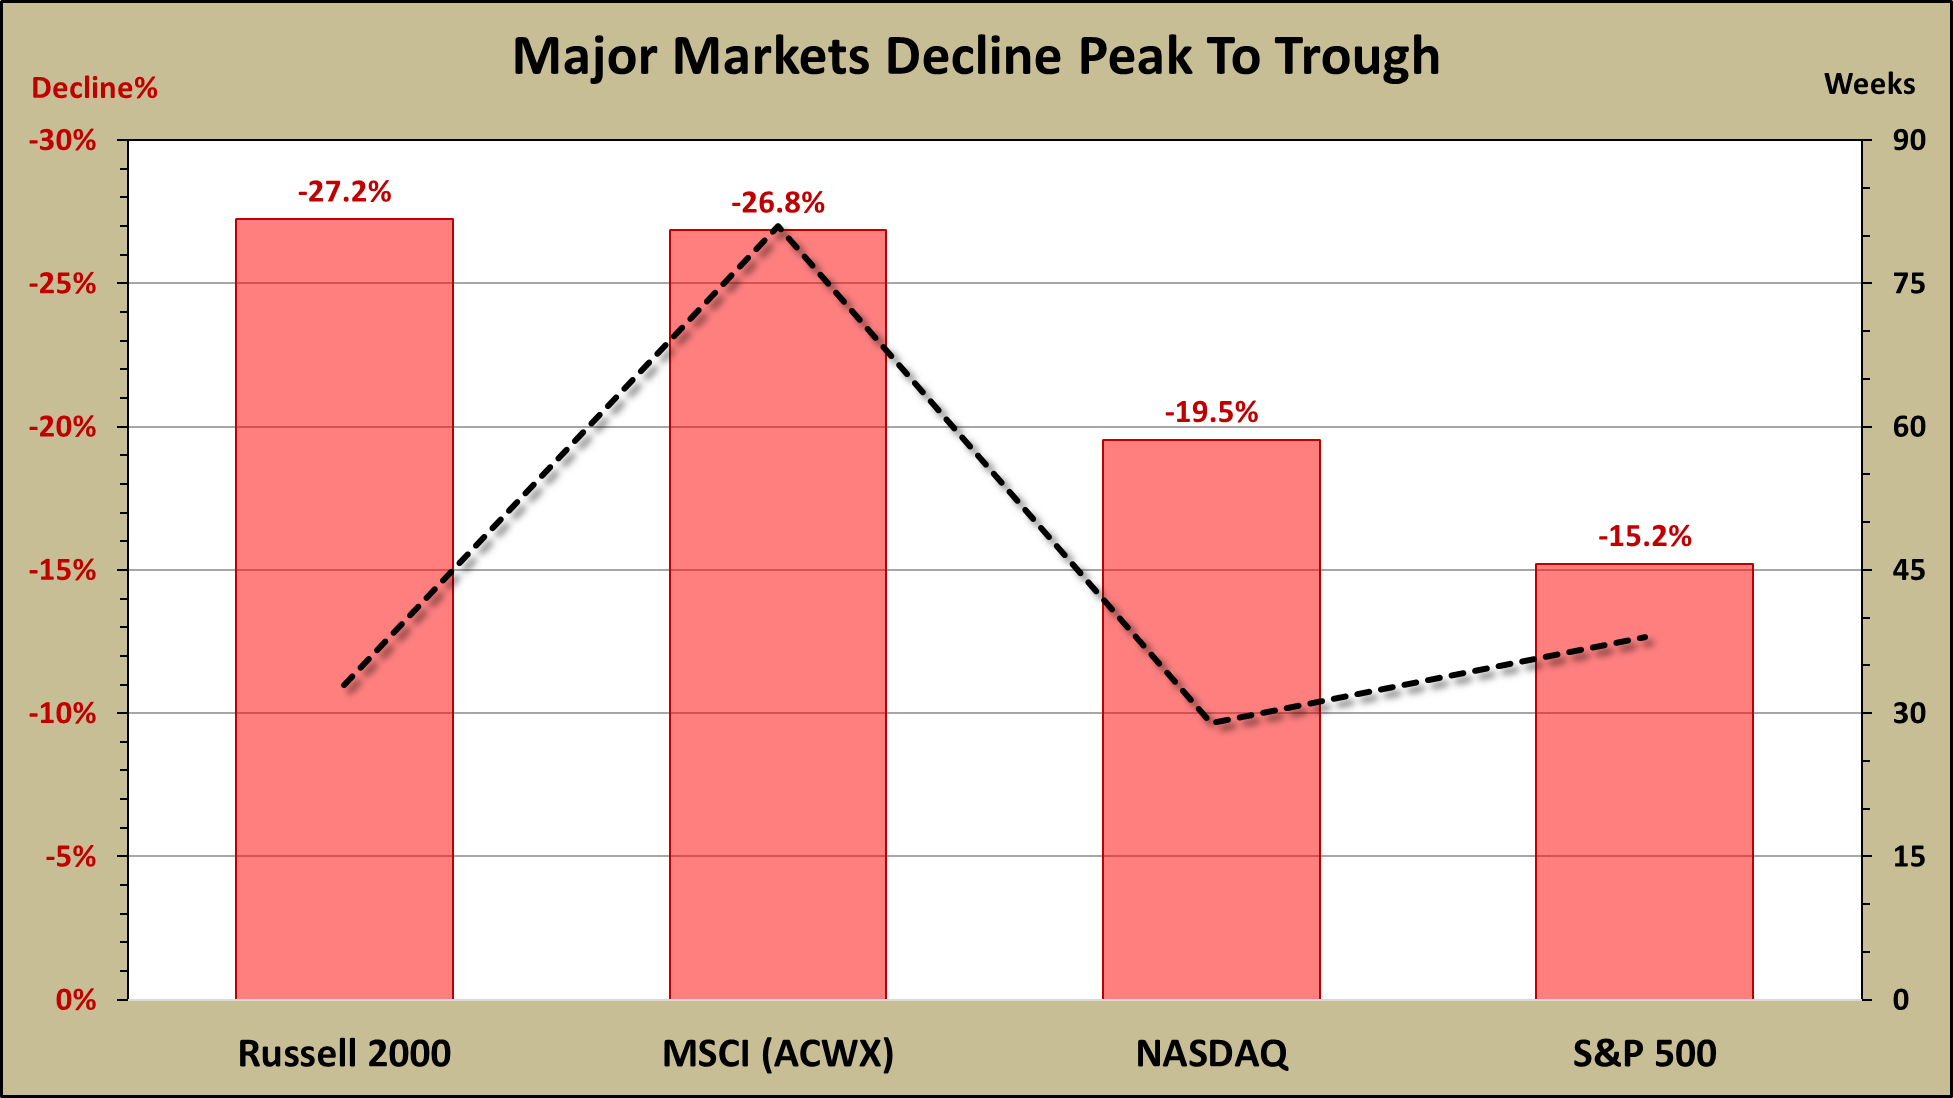
Measuring from peak to trough, the S&P 500 Index has declined about 15% over 38 weeks. This is mild compared to other segments of the total stock market which have crossed the technical “bear” 20% decline threshold. Figure-6 further shows that…
- The NASDAQ has declined almost 20% over 29 weeks
- The U.S. small-cap Russell 2000 Index has declined 27% over 33 weeks
- The MSCI ACWI exUS (total international) has declined 27% over a volatile 81 weeks
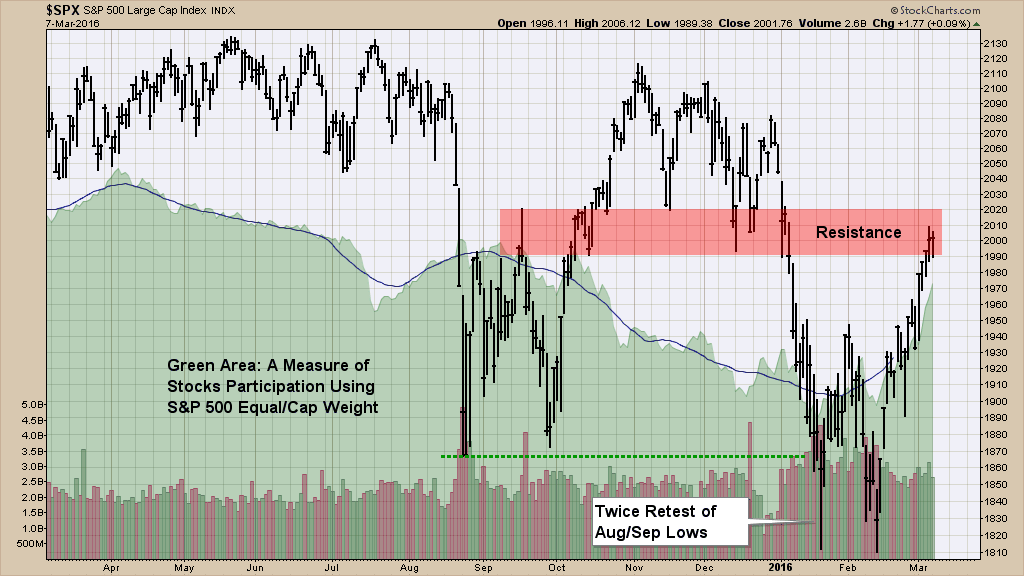
The S&P has rebounded nicely since retesting August/September lows in January and again in February. Price has reached the “resistance” area we delineated in our Market Update February 2016 article.
“People are generally optimistic about the future, and markets are made up of people.”
Each time I show a price chart, I like to feature another one of the many measures of individual stock participation we use at Coherent. The green area in figure-7 represents the relative performance between the equal-weighted and cap-weighted S&P 500 Index. Compare the recent rally off the lows to that during October.
The Near-Term…The Longer-Term
I discussed in my previous article things I liked and didn’t like about the market in recent weeks. Our market participation indicators continue to improve since the market rebounded in February off a retest of the summer lows. We have had four consecutive quarters of year-over-year operating earnings contraction, the worst trend since 2009. The silver lining is that 2015 earnings have set a low bar for 2016, but growth will depend on a rebound in sales.
I would still like to see more strength among leading stocks in more traditionally growth sectors. Meanwhile, valuations are still relatively high, indicating that that perhaps much of the hoped-for growth has been priced-in. In the near term, there is still a risk of retesting lows. In the longer term, market declines are a means of working off over-valuation and excessive optimism, preparing the way for a new market rally.
Warm regards,
Sargon Zia, CFA
March 8, 2016
You are welcome to comment!
Published quarterly, Earnings Insight provides an analysis and summary of material trends in company earnings reports as interpreted by the author and Chief Investment Officer of Coherent Financial Advisers.
Footnotes:
- Factset Research Systems, https://www.factset.com/, March 4, 2016
- S&P Dow Jones Indices, us.spindices.com as of March 3, 2016