Market Update February 2016
Since we began reducing equity exposure on July 15, we have been monitoring the market to determine a relatively low risk re-entry point. Our intent is to put cash back to work over time, as we sense the that market is looking to start a new up-trend. In this Market Update we wish to update you, our clients, on our perspective of the current markets and our near term outlook as these relate to how we manage your portfolios.
Our Goal Is To Manage Risk, Not Return
We conduct our own research for use in managing our clients’ wealth. In broad terms, our research involves measuring the market’s fundamental health such as sales and earnings trends. Concurrently, we analyze how the market is reacting to new information in terms of individual stock participation, sector leadership, and the price action of major market indices.
Our goal is to manage risk, not return. We can only take that return which the market provides. However, what is in our control at all times is the risk we are willing to take. At any given time, there are two risks we regard:
- being over-exposed to the market and participating fully in a significant decline
- being under-exposed to the market and participating partially in a significant rally
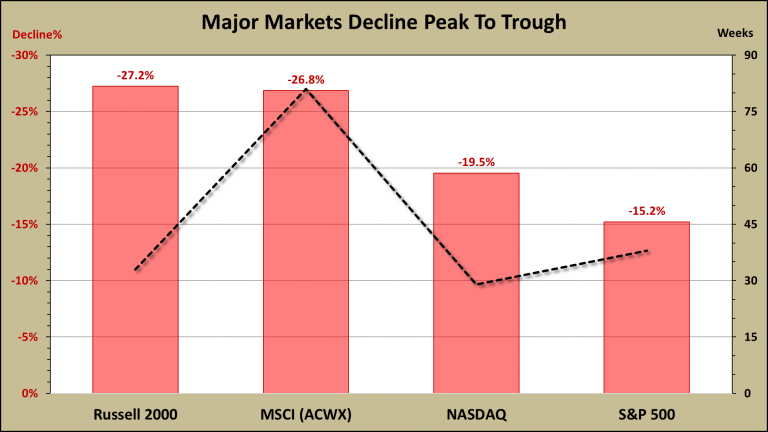
Last summer we proactively chose to reduce the first risk. The S&P 500 Index has declined about 15% since its summer peak. The smaller companies comprising the Russell 2000 Index have declined over 25%. The further the market declines, the larger the second risk becomes.
What I Like About This Market
What I like at this moment is somewhat limited and not highly compelling:
- Sentiment is bearish and near multi-year lows
- Major indices have undercut their August lows and have retested
- Individual company participation has improved in the recent bounce
Sentiment can remain bearish through the last day of a contracted market decline. So the more bearish sentiment becomes, the better the chances of a correction ending.
According to MarketSmith1, one of our data providers, Investor Intelligence2 sentiment among investment advisers recently surveyed shows that 40% were bearish. Over the past five years, the highest bearish sentiment was 46%. Meanwhile, only 26% were bullish which is very close the five-year low of 24%.
Markets usually do not move in a straight line, but rather bounce along a trend. Down-trends are usually more volatile as they make lower lows and lower highs. Eventually, a new up-trend begins after a previous low is “tested”, sometimes more than once.
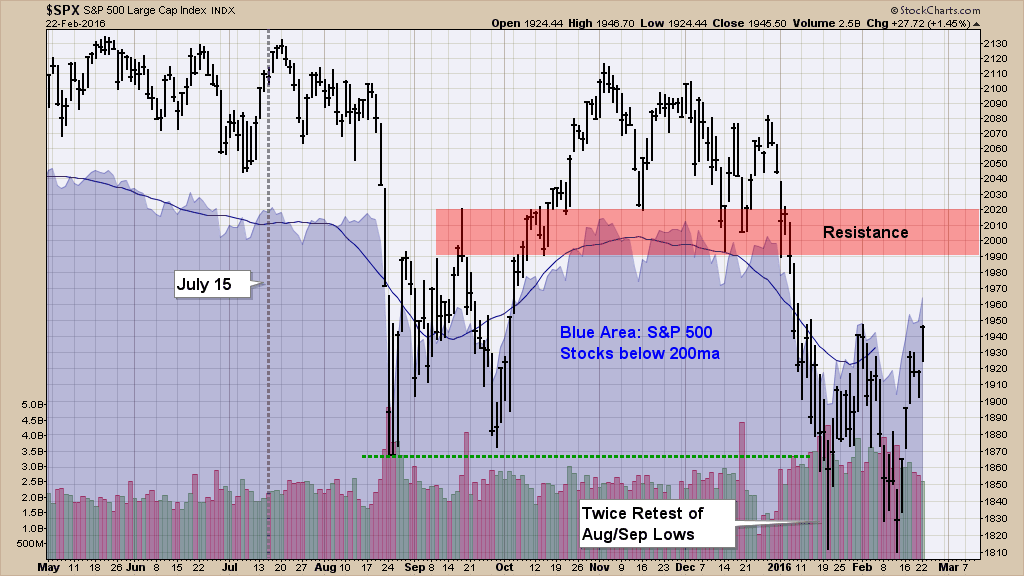
Recent market price action has been somewhat encouraging. For instance, in January the S&P 500 Index undercut its August lows. This new January low was subsequently retested on February 11. Although this retesting action does not always mean the end of a decline, it shows that at least for the time being selling pressure has subsided.
Caveat: The bounce in the six days since February’s retest have come on declining volume. This indicates a lack of conviction on the part of buyers, at least for now.
We also noted that market participation has improved. More individual stocks are participating in this six-day. One such indicator is the blue are on the chart above. This indicator made a higher high in February as the market retested its January low, and it has turned up making a higher high.
What Worries Me About This Market
What worries me about this market is that:
- valuations are still high even after the recent market decline
- estimates for positive revenue and earnings growth have been postponed for the second half
- there is little growth leadership both at the sector and individual stock level
Although there is some positive action in the major indices, performance has been coming mainly from beaten down or defensive sectors like energy, materials, and utilities. Furthermore, there is a lack of strong individual stock leadership coming from traditionally growth industries. Gold mining stocks have been doing well recently, but few of these companies are growing sales and earnings. I just don’t see a market rally being sustainable on water, gas, and electric.
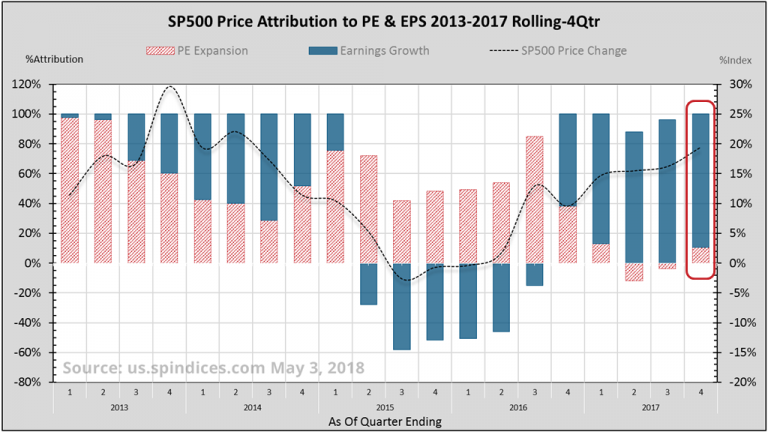
The market’s health as measured by sales and earnings growth has been poor. One can argue that this is expected even as a market bottoms because market looks forward. The question is whether the market believes company revenue and earnings growth will turn positive sooner rather than later. Furthermore, will growth rate be significant enough to justify still lofty valuations?
Looking Back:
Full year 2015 operating earnings are more than 95% in and it’s not a pretty picture. S&P 500 operating earnings for 2015 were estimated to be $131 per share at the start. Reality is approaching less than $103, a 22% drop. Calendar 2015 earnings estimates calling for more than 12% growth are now approaching 9.1% contraction compared with 2014. That’s more than a little miss.

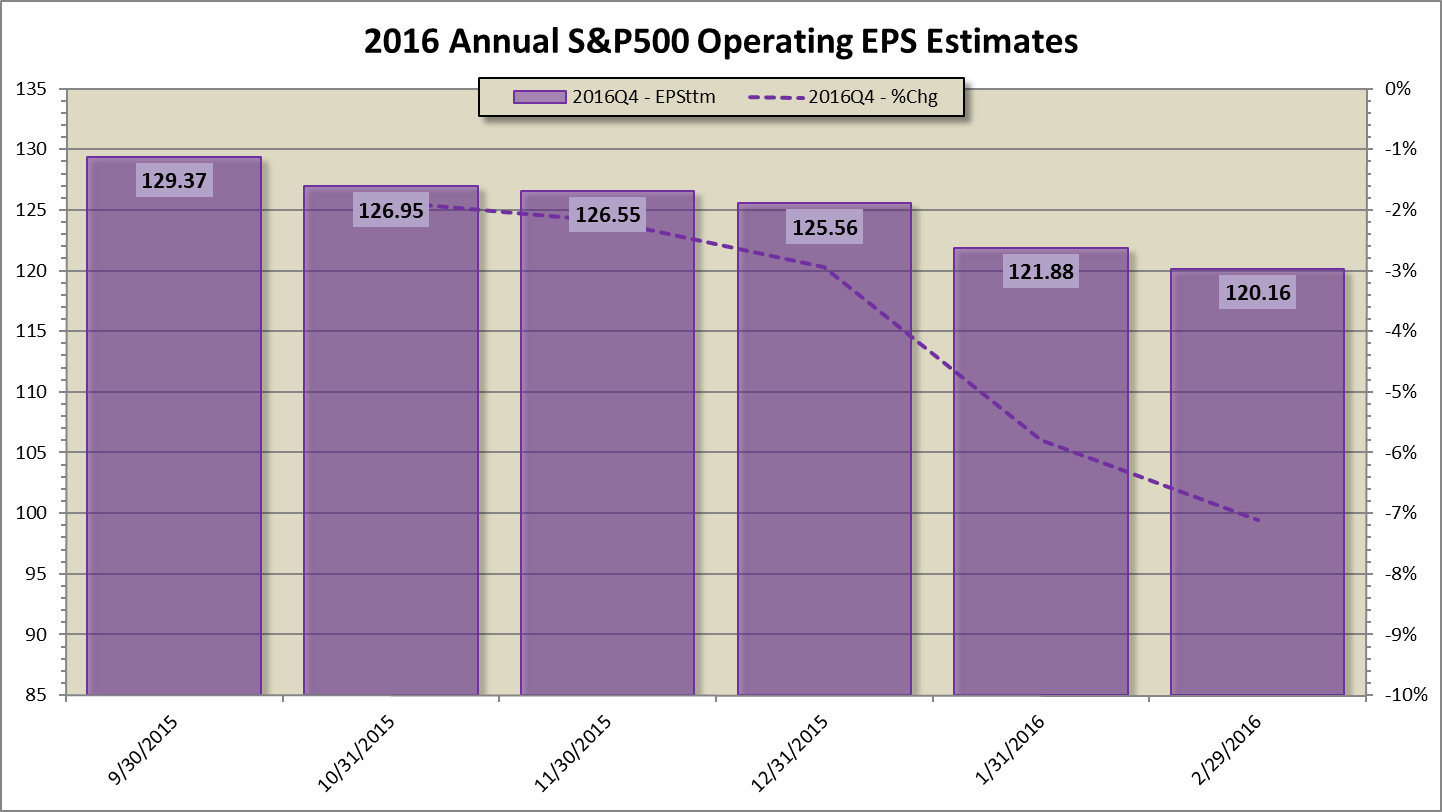
Looking Forward:
We are more than 85% through the fourth quarter earnings season for S&P 500 companies. The equity market is still in contraction both in terms of sales earnings growth rates. Of the 97 companies issuing guidance3 for the first quarter of 2016, 80% are issuing negative guidance.
Estimates two quarters ago called for strong positive growth to have resumed by year end. Now this turn is not expected until the second half of this year. Five months ago, S&P operating earnings for 2016 were estimated4 at about $130, but now have been trimmed to $120. First quarter operating earnings growth estimates alone are down 11% during this period.
The market has declined 15% from peak to trough and valuations are still high, higher than they were at the peak of the 2007 market.
Until A More Compelling Argument Can Be Made…
The further the market declines, the more the risk of being under-exposed into a rally increases. So, we cannot simply ignore the market’s January and February technical retest. Last year I removed 1/3 of equity exposure and put it into cash (rather than bonds). Recently I put a small portion of this cash back into equities.
I think the risk of lower lows is still elevated. I forecasted a range for a market bottom in my Manager’s Letter 2015 Q3 and expounded upon it the recent Coherent Investor February 2016 article. At this moment I hold to these targets until a more compelling argument can be made for returning to a full allocation in equities.
In our great country, a new uptrend has always followed a drawn out correction. When the new up-trend begins, if it hasn’t already, the investor will have to move quickly. Market reversals can be as volatile as the preceding bear.
Warm regards,
Sargon Zia, CFA
February 22, 2016
You are welcome to comment!
Published regularly, the Coherent Investor series focuses on the current conditions of the securities markets as interpreted by the author and Chief Investment Officer, unifying multiple investment disciplines including fundamental and technical analysis.
Footnotes:
- MarketSmith, February 22, 216, https://www.marketsmith.com/
- Investors Intelligence, https://www.investorsintelligence.com/
- Factet Research Systems, February 19 2016, https://www.factset.com/
- S&P Dow Jones Indices, February 18, 2016, https://us.spindices.com/