Earnings Insight August 2017
On August 21, the Great American Total Solar Eclipse will trace a “path of totality” across the continental United States. Allegorically, expectations of accelerated earnings growth may become eclipsed by looming comparable earnings hurdles at already elevated stock market valuations.
This quarterly Earnings Insight series is dedicated to answering three questions: What are the market’s expectations for growth? Are expectations grounded in a reasonable and rational basis? And how much expectation is already priced into the market?
In this August issue, I want to address these questions within a more foundational context:
- How Earnings Level Affects Stock Market Price
- How Earnings Growth Affects Stock Market Price
- A More Realistic Case For 2017 Earnings Growth
Note: all “current” data is as of the end of July with S&P highs near 2484. Earnings, margins and PE are operating figures.
How Earnings Level Affects Stock Market Price
The stock market’s price at any time can be described as the previous four quarters’ earnings times some magic multiple. Price and earnings are given, while the multiple is derived. Dividing the S&P 500 Index price level by its earnings1 per share renders the price-earnings multiple or “P/E ratio” (PE for short).
Earnings estimates help us set fundamentally reasoned expectations for future market prices.
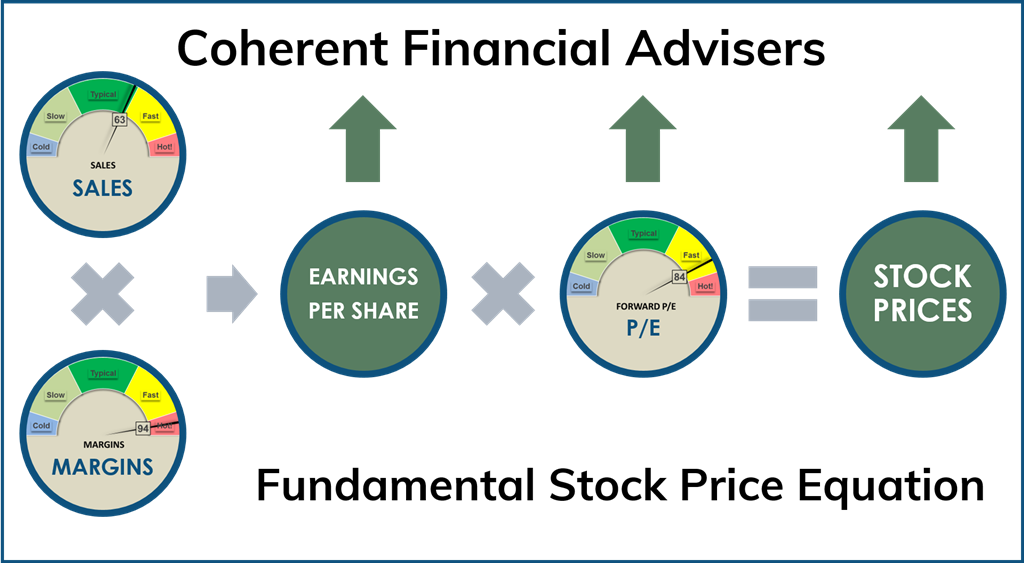
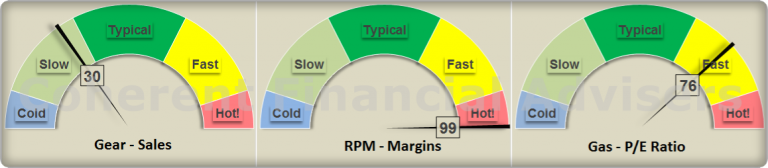
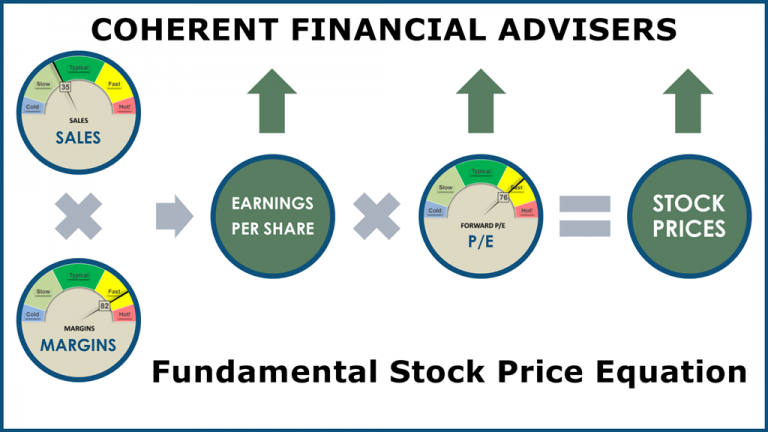
The diagram in figure-1 helps visualize this relationship. Margin2 describes the percentage of sales which makes it down to earnings after paying expenses. So, as sales or margins rise, earnings rise. And as the earnings level rises, stock prices rise by a factor of PE.
PE is analogous to comparing home prices in terms of their price per square-foot. You can increase your home’s value by adding more space (increase earnings), or by improving its quality (sales versus margins). Home prices also rise when buyers are willing to pay more for the same space (rising PE).
What about future expectations?
As investors, we want to know what price level to expect looking forward. Earnings estimates help us set fundamentally reasoned expectations for future market prices. The forward PE multiple reflects how rich the market is. Conversely, multiplying forward earnings by a reasonable PE yields a “fair value” to compare against current prices.
How Earnings Growth Affects Stock Market Price
The forward PE ratio is the price investors are willing to pay today for each dollar of expected future earnings. A higher expected earnings rate of growth justifies a higher multiple. Expecting $100 of earnings growing at 15% is worth more today than $100 growing at 5%. So, how is earnings growth rate determined?
Expanding earnings growth has a multiplicative effect on market prices.

Growth is measured by comparing one period’s earnings to the same period the year before. Earnings growth is the product of both sales and margins growth, as demonstrated by figure-1. As sales or margins levels rise over time, they become increasing hurdles to growth in future periods.
The hurdle effect of earnings growth
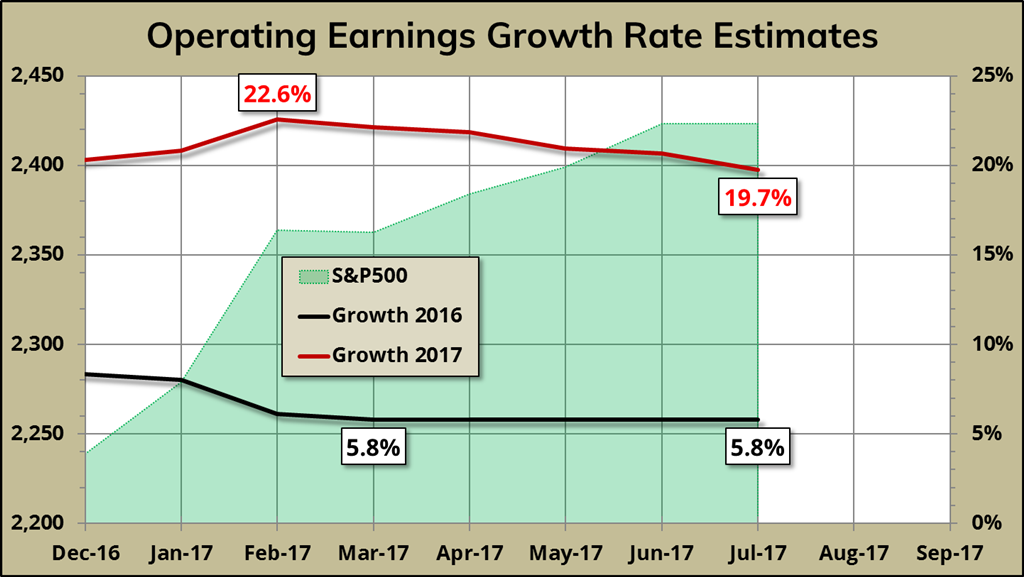
Figure-2 shows 2016 sales rising (top panel), and margins rising (bottom panel). Over time, these compound the hurdle to generating growth in 2017. And as 2017 earnings levels rise, they become larger impediments to 2018 growth. This is the looming challenge.
In contrast, 2015 earnings declined below 2014, and earnings growth contracted 11.1%. The silver lining then was that 2015 earnings levels offered a lower hurdle for growth in 2016. Figure-2 demonstrates that this silver lining has evaporated3.
The multiplicative effect of earnings growth
A higher expected earnings growth rate justifies a higher PE. Therefore, expanding earnings growth has a multiplicative effect on market prices. While higher earnings increase prices by a factor of PE, a higher earnings growth rate raises that PE.
This is what we are witnessing in 2017. Sales and margins growth have expanded, driving earnings growth into double-digits. That’s great for 2017. But It also means more challenging hurdles ahead for 2018.
A More Realistic Case For 2017 Earnings Growth
First quarter figures are in the books3. Sales growth was 6.8%, the highest in the 5-years since 2011-Q4. Margins came in at 9.8%, a 12.5% growth over the same quarter last year. 2016-Q1 provided a low hurdle for 2017-Q1’s 20% earnings growth.
Ending July, 58% of S&P 500 companies had reported second quarter earnings. Blended4 Q2 estimates so far are lower than earlier forecasts. Meanwhile Q3 and Q4 are still only estimates. We are 40% into the full year’s reporting period.
If sales growth and margins levels reverted to their long-term means, well, that would be a bad day.
Operating 2017 earnings estimates started the year at $131. They’ve declined steadily to $127, with a forward PE of 19.5. That’s still a handsome 19.7% expected growth over last year (figure-3). And, it’s still handsomely optimistic.
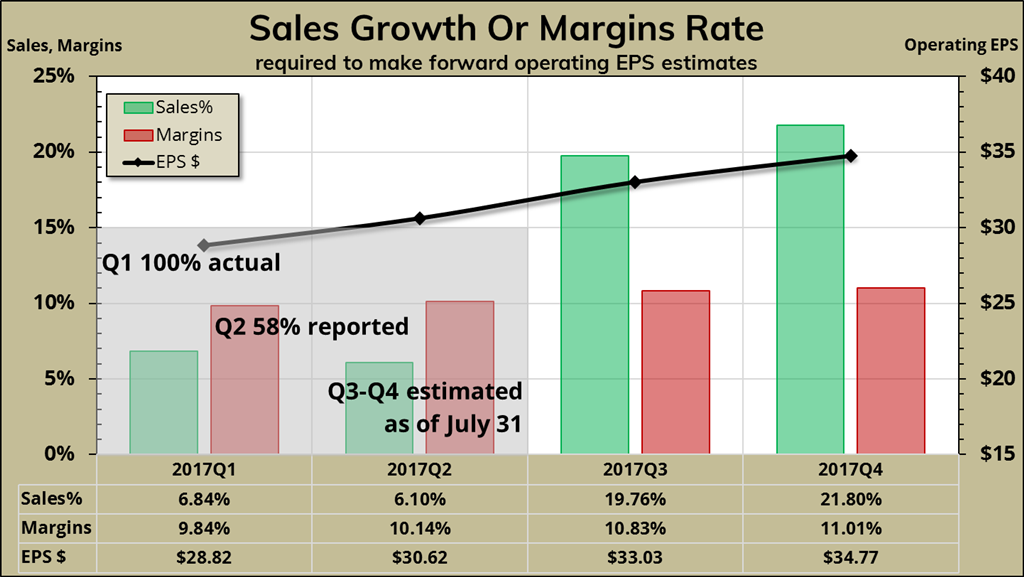
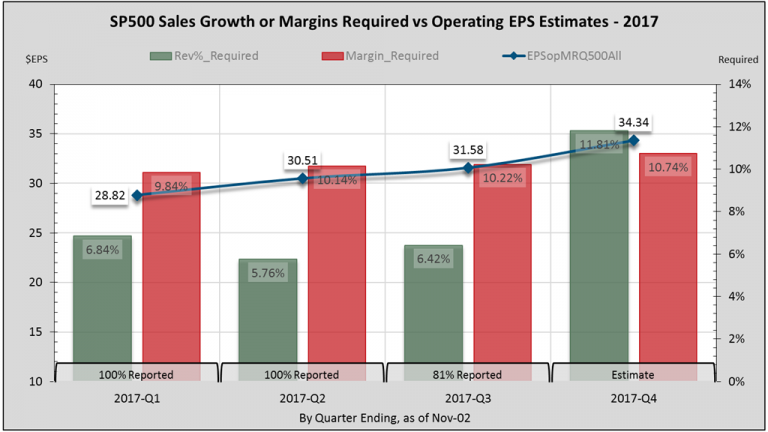
The black line in figure-4 shows quarterly 2017 earnings totaling $127 per share. Green bars show sales growth required to make target earnings, if margins held their 4-year median of 9.5%. Red bars show margins required if sales growth averaged a 15-year median rate5 of 4.9%.
First and second quarter results have fallen short of their earlier forecasts. To achieve current full year estimates, Q3-Q4 sales have to maintain 21% growth at 9.5% margin. Alternatively, margins must average 11% at 4.9% sales growth. Based on historical patterns, neither is likely.
More realistic growth expectations
Optimistic: If 2017 margin levels track their 17-year maximum of 10.1%, margins growth will not exceed 9% this year. The highest non-consecutive 4-quarter average since 2011 was 6.7% growth. At maximum margins levels, 2017 earnings growth tops at 16% or $123.26, with forward PE at 20.
Reasonable: A more reasonable 5% sales growth at 9.9% margins level yields 11% earnings growth or $118.27 for the year. Margins would be well above their 15-year median of 8.7%, with forward PE an ear-popping 21.
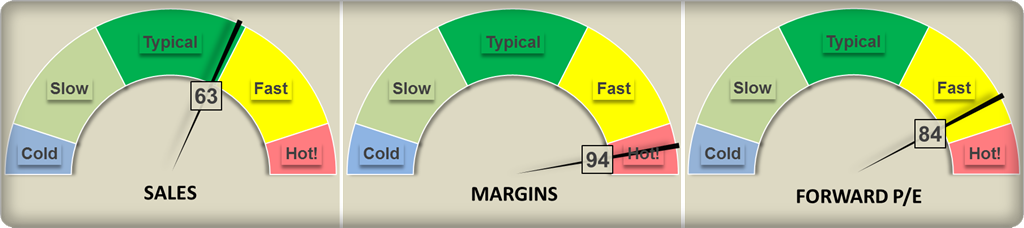
Realistic: A more realistic outcome is for 8% earnings growth to $114.80. This puts forward PE at 21.6. And that, my friends, is the problem – valuation!
Reversions Can Be Mean!
Yes, we’ve turned a corner from the “worst since” to the “best-since” and that’s very refreshing. What worries me is the market seems to have priced-in optimistic expectations. If sales growth and margins levels reverted to their long-term means, well, that would be a bad day.
The market has its own self-stabilizing, or dare I say self-correcting mechanism. It engages when fundamentals have never looked better. After all, solar eclipses happen during the day.
Warm regards,
Sargon Zia, CFA
August 3, 2017
You are welcome to comment!
Recommended Reading:
More Earnings Insight Series
What Moves The Market?
Coherent Investor: 2017 Possibilities
Published quarterly, Earnings Insight provides analysis and summary of material trends in aggregate U.S. company earnings as interpreted by the author and Chief Investment Officer of Coherent Financial Advisers.
Footnotes:
- In this Earnings Insight series, we focus on key revenue and earnings trends. Our analysis is based primarily on aggregate forward looking estimates of the S&P 500 Index revenue and operating earnings. We want to pay attention to real and recurring drivers of company growth, looking past the non-cash and accounting related practices. Therefore, we have chosen to analyze operating data where possible, rather than as-reported figures usually cited.
- Margin: Expenses are typically measured in terms of earnings left over from, and in proportion to revenue. Given $100 sales and $92 expenses per shares, margin becomes 8% or $8 per $100 of sales. Increasing margins means decreasing expenses in proportion to sales.
- Data source: S&P Dow Jones Indices, us.spindices.com as of July 31, 2017, with about 58% of S&P 500 companies having reported second quarter earnings. Therefore, full year 2017 estimates are a blend of 40% actual, and 60% estimated figures. Values are rounded for ease of reading. Analysis and interpretation provided by Coherent Financial Advisers.
- Blended estimates combine actual reported figures with estimates for those companies not yet having reported.
- In past illustrations, we used the median 4-year sales growth as a reasonable reference. Sales growth has exceeded this reference for each of the past 3-quarters. Therefore, we have changed the reference to the 15-year median.