Coherent Investor December 2016
After a rough start, 2016 appears to be headed into a good close for equity markets. In this last Coherent Investor series issue of the year, we review possibilities for 2017 earnings. We consider variables from three perspectives, fundamental market drivers such as sales and margins, cyclical and seasonal factors, and economic conditions.
“All else is equal about as often as the market facing certainty.”
Fundamentally, margins and PE are a headwind to stock markets at this time, as are impending cyclical and seasonal patterns. Time tested monetary tools and some newly invented ones have been in play for some time now, but growth has been tepid. Perhaps the winds of political change can help blow the lid off growth.
Fundamental Perspective
Third quarter earnings reporting season is mainly complete, and the fourth quarter will commence in January. Over-optimism remains the theme, but earnings are improving. Let’s evaluate where we stand for full year 2016 and 2017 earnings expectations.
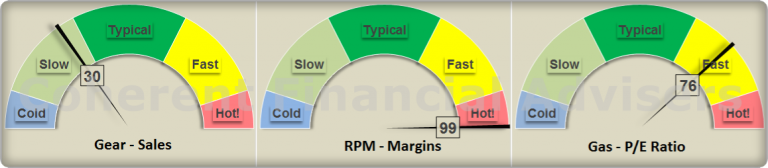
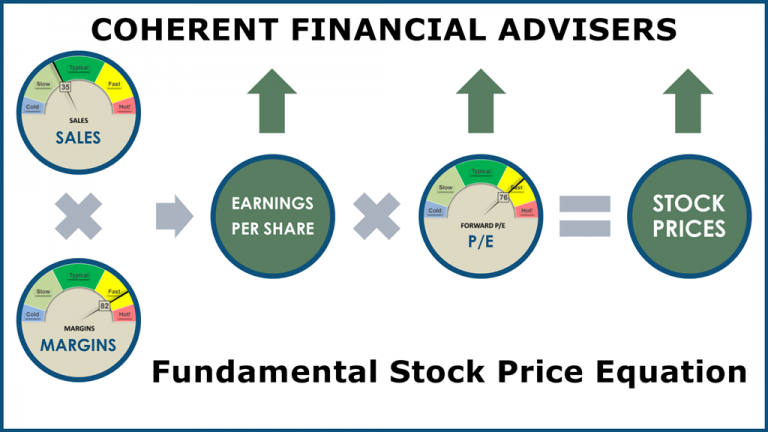
Operating earnings growth is determined by sales and operating margins growth. Market indices reflect how much investors are willing to pay for each dollar of earnings. This is the basic relationship, from sales to stock prices.
“The S&P has to deliver record sales growth at near-record margins.”
As usual, S&P 500 Index operating earnings1 are our proxy for general US stock market analysis. The following chart shows three trends on a calendar quarter basis as of the end of November:
- S&P index closing price (light blue area)
- Operating earnings actual & forecast (dark blue bars)
- Forward operating price-earnings ratio or “PE” (red line)
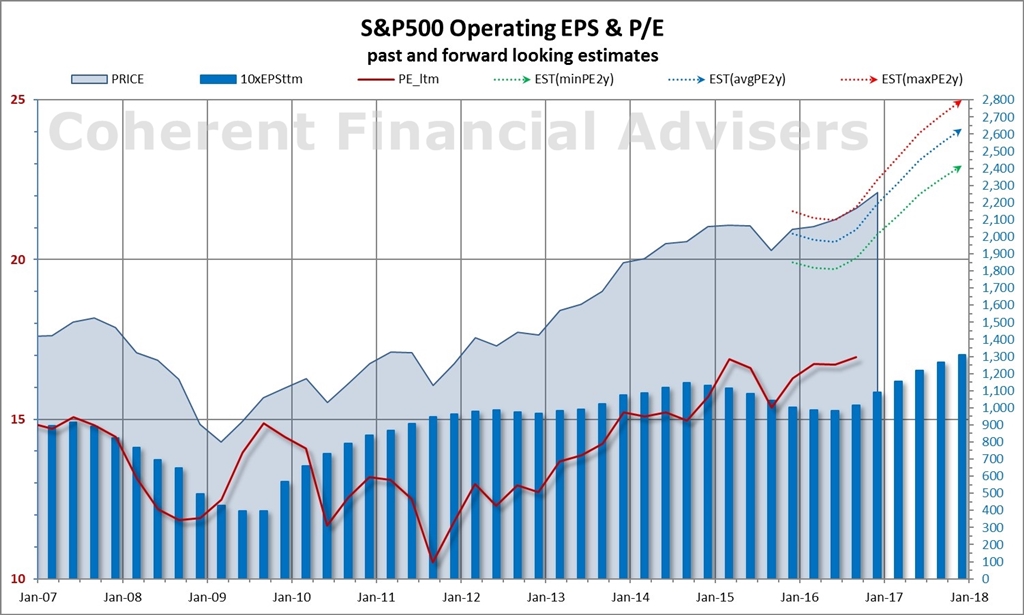
Current year blended earnings estimates stand at $109 for an 8.6% growth over last year. Though a far cry from the 18% estimated in January and still a bit optimistic I think, it’s a substantial improvement over last year’s 11% contraction.
Analysts estimate 2017 earnings at $131, a 20% increase over the current year’s $109. I think achieving current 2017 earnings estimates is unlikely through revenue growth alone, without some help from higher margins.
Over the past 15 years, rolling 4-quarter sales growth has averaged 3.3%, maxing at about 12.5% (calendar year sales growth topped out at 11%). Margins have averaged 9.2% so far this year. Assuming record sales growth of 12.5%, margins must exceed of 9.8% on average.
The S&P has to deliver record sales growth at near-record margins. My mantra for the past two years has been “over-optimistic”. I don’t see that changing anytime soon, but all hope is not lost. As I’ve often stated, PE is the wild card.
As mentioned in November’s Earnings Insight article, the “silver lining” I first discussed in March has arrived. Earnings trended lower through the middle of 2016, then reversed higher. If earnings continue to rise, mid-2017 will be the apex for the silver-lining-tailwind effect of relatively easy comparable EPS growth.
Cyclical and Seasonal Perspective
Fundamental factors explain only part of the market’s price behavior. Cyclical analysis examines the periodic oscillations present in the financial markets. Seasonality is an entirely different concept as I discussed in my July article What Moves The Market? Both cyclical and seasonal factors point to a correction of the 2009 bull market, bottoming approximately in 2018.
“Fundamental factors explain only part of the market’s price behavior.”
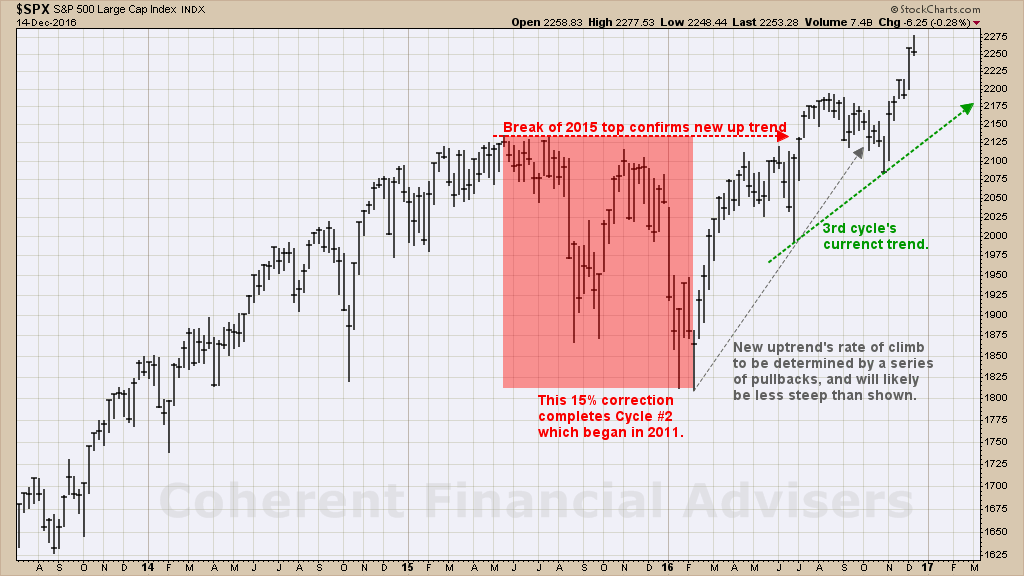
Using cyclical analysis, I offered the following chart of the S&P 500 in September’s Coherent Investor article. The chart, which I’ve updated below, shows two correction cycles since 2009, bottoming in October 2011 and February 2016. We are presently ten months into the third cycle.

At some point, the major support trend line of 2009 (solid green line) will be tested a third time and broken, with a correction bottoming perhaps in 2018. However, I do not believe – as some fear – that the correction will be on the same scale as those in 2000 or 2007.
For now, this third cycle is trending upward as is obvious in the next chart. In September’s article, I expected the up-trend to experience pullbacks which would define a shallower rate of climb than we were experiencing in September. The pullback preceding the election was the first, and I am expecting more along the way.
There are also seasonal factors in play. According to our own internal studies2 of market seasonality, December returns have proven to be significantly above average. So far, this December is playing out according to Hoyle.
Furthermore, 2017 is a post-election year with a change in political parties. According to the Stock Trader’s Almanac3, “A takeover of the White House by the opposing party in the past 50-years … has resulted in a bottom within two years, except 1944, a flat year.”
Economic Perspective
Relative to more recent post-recession recoveries, the current one has been marked by a notably slower rate of growth in Gross Domestic Product, or GDP. The following chart shows how nominal GDP (black line) has been trending between 2.5% and 5%. Naturally, this slower growth has been reflected in the S&P’s revenue growth which has averaged about 3.5% since mid-2010.
“The danger with regard to inflation is if unexpected growth catches The Fed off guard with excess money supply in the market.”
Fear of significant inflation has been a subject on investors’ minds for many years. Often, the primary factor cited is the unprecedented increase in the money supply (red line) as a result of the Fed’s response to 2007 and the global financial crises. But an important contributor to inflation has been lacking: growth.

The Personal Consumption Expenditures Index, or PCE (yellow line), has been relatively flat this whole time, and well below The Fed’s current 2% target rate. What has worried The Fed is deflation, not inflation. As mentioned in our August article, The Fed’s Expanded Toolkit, Fed Chair Janet Yellen cites studies which have found that . . .
“Our asset purchases and extended forward rate guidance put appreciable downward pressure on long-term interest rates and, as a result, helped … prevent inflation from falling further below our 2 percent objective.”
The Fed estimates4 reaching its target inflation rate around 2018. After its federal funds rate increases are well under way, The Fed intends to begin phasing out its reinvestment policy, stabilizing the money supply. The danger with regard to inflation is if unexpected growth catches The Fed off guard with excess money supply in the market.
There are changes looming in The Fed’s makeup since the US elections. The Board of Governors are nominated by The President and confirmed by The Senate, who will have the opportunity to fill 2 positions left vacant since mid-2014. The current Fed Chair’s term expires in less than 15-months. Productivity increases and workforce participation will be a challenge to growing the economy.
Ready, Set, Grow
I am often amused (irritated) when I hear the cliché, “The markets are facing uncertainty.” As opposed to what I wonder, certainty? It’s like a sports announcer declaring, “They came to play”. How Insightful.
One thing is certain: growth cures many ills, all else being equal. Of course, all else is equal about as often as the market facing certainty.
Until the next issue, this coherent investor wishes you a joyous holiday season, and a very happy new year.
Warm regards,
Sargon Zia, CFA
December 15, 2016
You are welcome to comment!
Published regularly, the Coherent Investor series focuses on the current conditions of the securities markets as interpreted by the author and Chief Investment Officer, unifying multiple investment disciplines including fundamental and technical analysis.
Footnotes:
- Data source: S&P Dow Jones Indices, us.spindices.com as of November 30, 2016, with 97% of S&P 500 companies having reported third quarter earnings. Values are rounded for ease of reading. Analysis and interpretation provided by Coherent Financial Advisers.
- In the 65 years since 1950, December returns averaged 1.49% at a p-level of 2.2%, excluding outliers beyond a 96% normal distribution, compared with the 0.69% returned on average for all months returned.
- Stock Trader’s Almanac 2016, Jeffrey A. Hirsch & Yale Hirsch, John Wiley & Sons, page 20.
- Federal Reserve Chair Janet L. Yellen, “Designing Resilient Monetary Policy Frameworks for the Future,” a speech on 8/26/216 in Jackson Hole, Wyoming, Figure-1. See www.federalreserve.gov/newsevents/speech/yellen20160826a.htm