Earnings Insight November 2016
In earlier articles, I introduced the “silver lining for 2016.” The further 2015 earnings declined, the lower the bar became for realizing a positive 2016 earnings growth rate. Third quarter earnings look to become the first growth we have seen in nearly two years. This silver lining has finally arrived, but not without its caveats.
“Finishing 2016 at $110 operating earnings puts us no further ahead than where we were in mid-2015.”
The Earnings Insight Series
Owners of common shares are referred to as “residual owners” because they own what is left over from revenues (sales) after paying all expenses. Therefore, forward looking earnings estimates are an important part of earnings season, and a significant determinant of the stock market’s long term trend.
In this Earnings Insight series, we focus on key revenue and earnings trends. Our analysis is based primarily on aggregate forward looking estimates of the S&P 500 Index1 revenue and operating earnings2. To capture the essence of earnings season, we bypass the minutia to answer three high-level, questions:
- What are the market’s expectations for growth?
- Are these expectations grounded in a reasonable and rational basis?
- How much of these expectations are already priced into the market?
In this article, we will cover the following topics:
- Third quarter earnings summary
- The financial periodic table of elements
- How earnings are shaping up for full year 2016
- The silver lining of 2016 (and 2017) is finally here
Third Quarter Earnings Summary
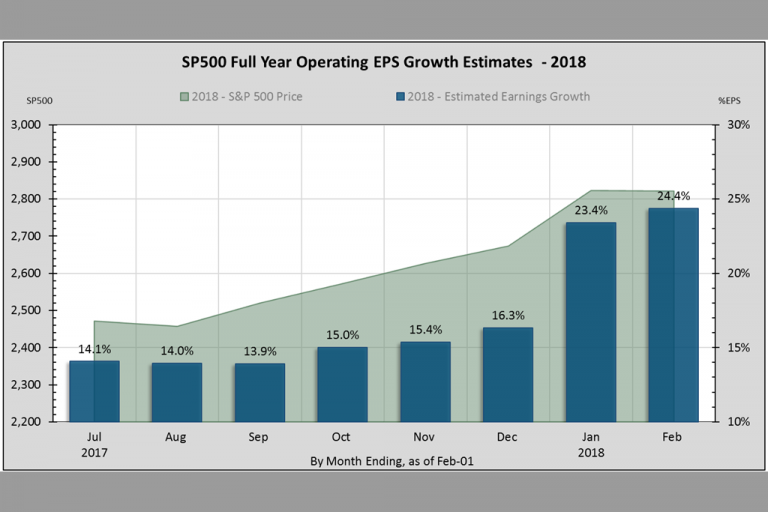
The market continues to be overoptimistic, but less than it has been the past two years. At the start of 2015, full year estimates of 12% growth became an 11% contraction, missing reality by 23% points. Blended3 2016 operating earnings growth estimates of 9% are now half what they were at the start of the year.
First and second quarter earnings came in 17% below estimates. Third quarter earnings estimates are down about 9% so far. Still, a full year miss of 9% points is closer to the mark than 23%. The market appears to be dialing in its estimates.

According to Factset Research4, Q3 2016 is looking to become the first year-over-year of revenue growth since Q4 2014, with a blended revenue growth rate of 2.7%. Energy has been the greatest detractor from both sales and earnings, contributing to 5 of last 6 quarters of earnings contraction.
The market has been under-rewarding earnings beats and punishing earnings misses more than normal this quarter. More companies reported positive earnings surprises than on average. Yet these companies have seen a below average price increase5. Meanwhile, companies missing estimates have seen a larger price decline than usual.
Why?
When the market disproportionately punishes earnings surprises, it is indicative of over-valuation, or excessively optimistic expectations. To appreciate this in more detail, it helps to understand my “financial periodic table of elements”.
Financial Periodic Table of Elements
There are fundamental elements which affect the stock market’s long term price trend. Let’s examine these elements using a car analogy, albeit imperfect.
“Our vehicle is the economy. If you want more horsepower, something fundamentally has to change.”
Consider these three variables affecting the speed or acceleration of an automobile: gas pedal, engine RPM, and gear shifter. We can go faster by stepping on the gas. But once the engine RPM peaks, we have to shift into a higher gear.
To drive stock prices higher, earnings must grow. Companies can increase margins6, but like an engine’s RPM, margins have limits. Or, like stepping on the gas pedal, investors can out of the goodness of their heart simply pay more for the same dollar of expected earnings (increase the forward-PE ratio). Beyond this, sales must shift into a higher gear to drive earnings, and thus stock prices higher.
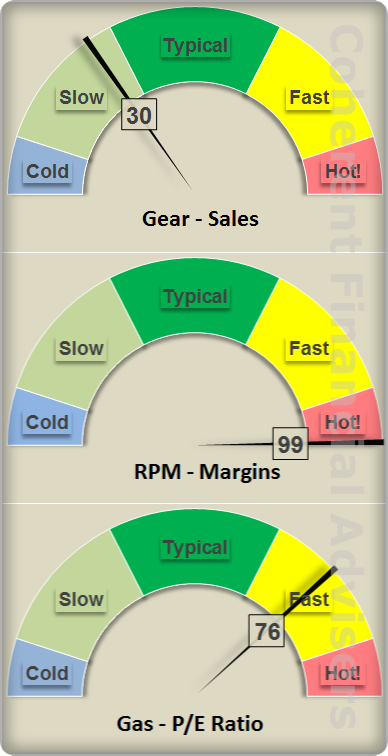
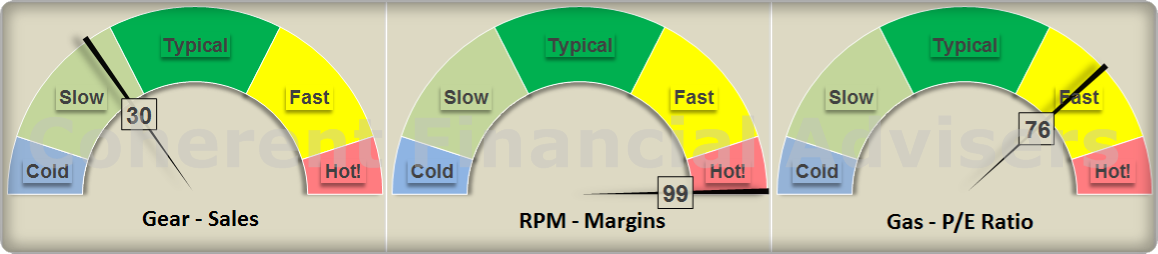
I developed this 3-gauge graphic to help describe were current sales, margins, and forward-PE are relative to their long-term averages. Keep in mind that it’s not just the level of sales, margins, and earnings that drives prices, but also the rate of change.
Forward-PE:
The S&P 500 PE ratio has been running above its 5 & 10-year average for nearly 3-years straight. Forward-PE is presently above the 2007 peak. However, while sales growth and margins are bound by the physical laws of nature, what people are willing to pay for a dollar of earnings is not. PE can go higher, especially if earnings growth accelerates, else caveat emptor.
Margins:
Current S&P 500 operating margins have “red-lined”, running at their highest level in over 16 years. This can continue until economic conditions eventually revert back to their mean. Like starvation diets, companies can cut costs only so far. Industries with attractive margins invite competition, driving margins back down.
Sales or Revenue:
Sales growth has been anemic for the entire post-2008 economic recovery. The good news is that sales growth has turned positive with room to grow. The bad news is that the PE ratio is high and margins have red-lined. Like a tug of war, one element can pull earnings higher, while two others pull against.

Our “vehicle” is the economy, the universe in which our elements exist. If you want more horsepower, something fundamentally has to change. A Prius can only go so fast before you have to switch to a Corvette.
Earnings Home Stretch
I developed the following chart to demonstrate the margins or sales growth needed to produce the market’s estimated operating earnings. The chart helps answer the question, “Are current estimates within the realm of reason?”
For many quarters now, the answer has been – no, not on this planet. First and second quarters earnings are already booked. With third quarter reporting almost completed, the blended sales and margins shown are close estimates. This leaves the fourth quarter earnings which companies will begin reporting in January.
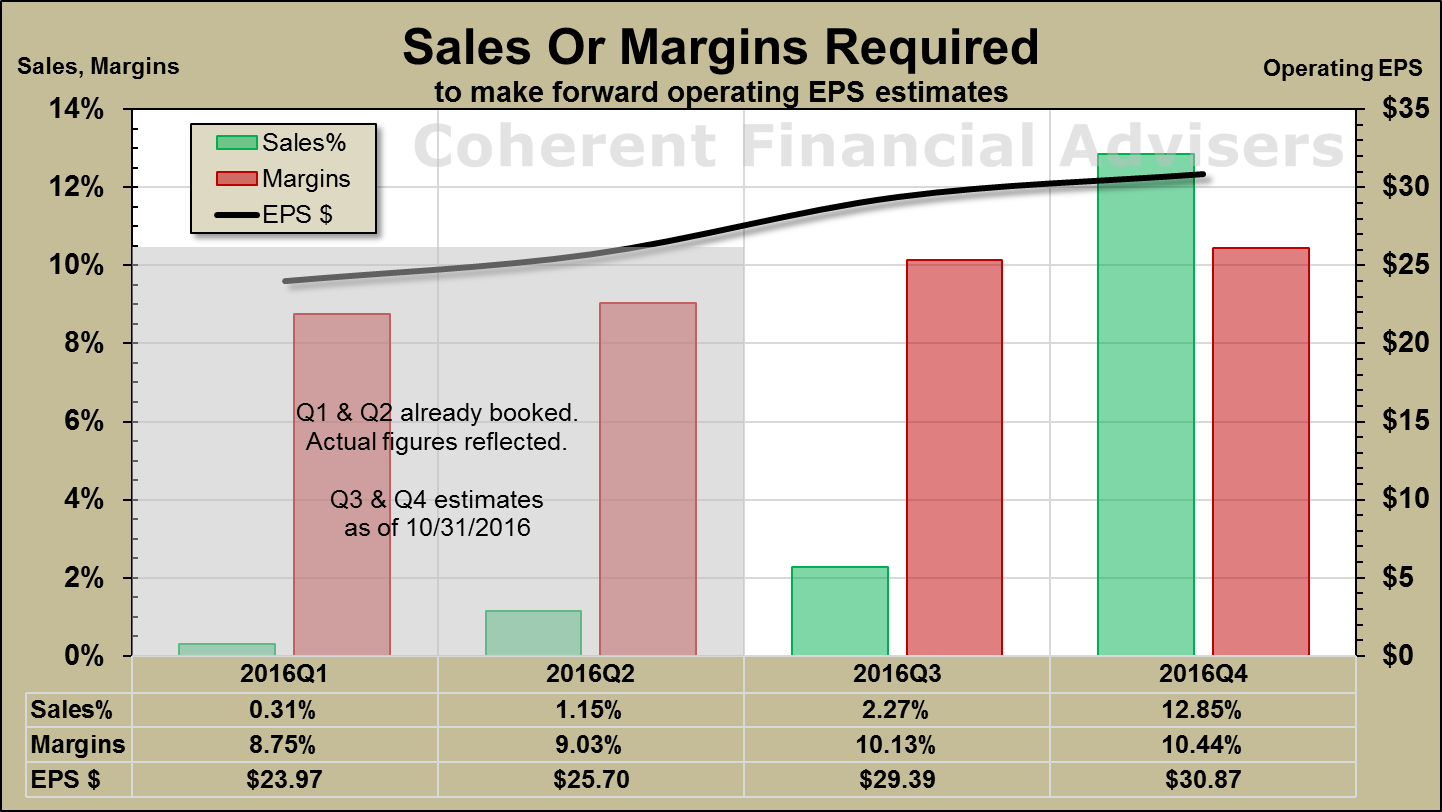
Earnings are the residual of revenue generated after paying expenses. For the S&P to earn $31 in Q4, either sales must increase, or margins expand. At the 4-year average margin rate of about 9.5%, sales would have to grow more than 12% to make $31 operating earnings.
“I found there was only one way to look thin: hang out with fat people.” – Rodney Dangerfield
But if margins stay at their current 10% level, sales growth would need only grow 7% over same quarter last year. In the last 63 quarters (over 15 years), the market has pulled off 7% growth 22 times, the last being five years ago. Considering Brexit, the Cubbies, and recent elections, let’s just say I’m reluctant to bet against novelty.
The Silver Lining Is Here, Finally!
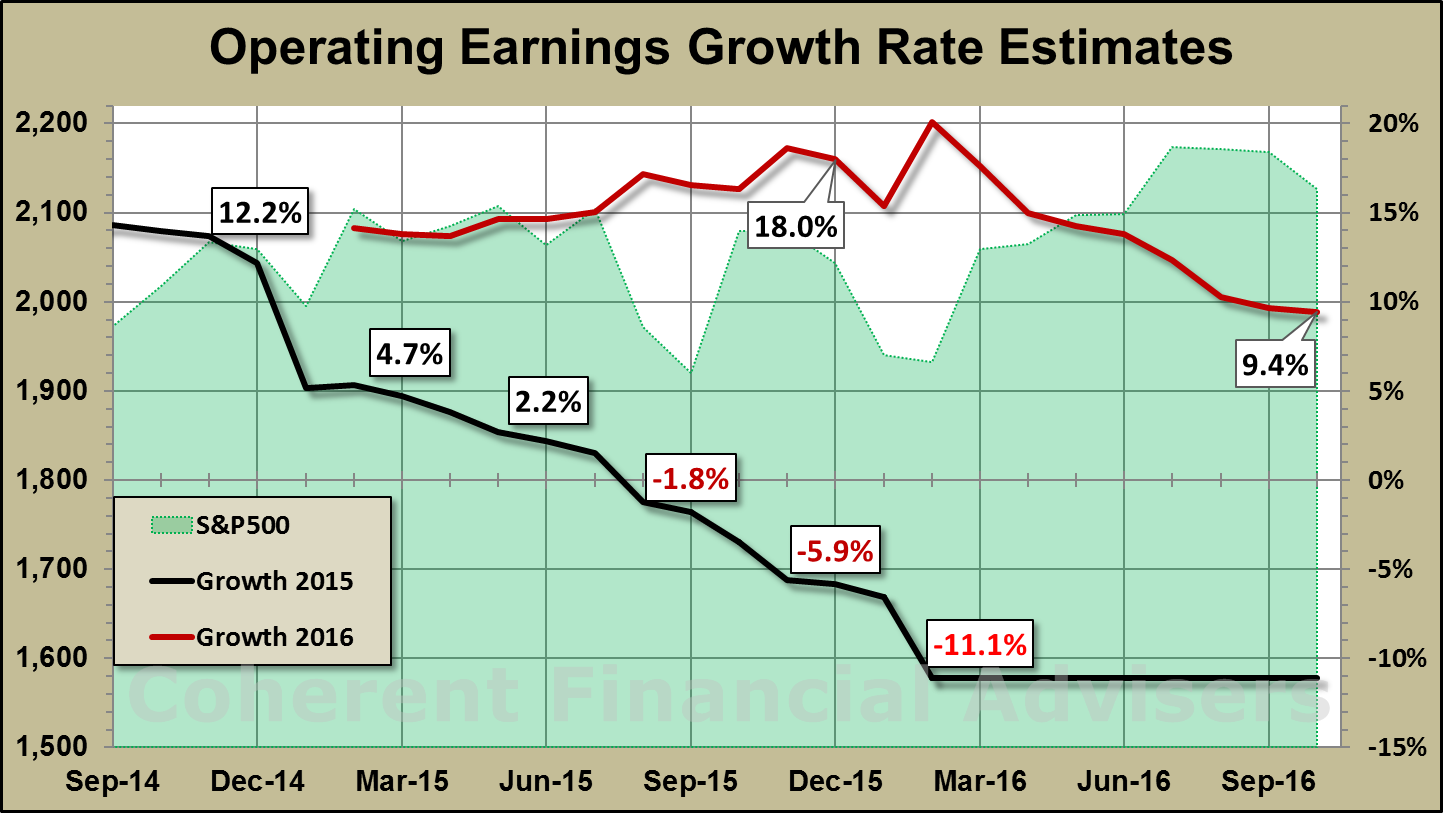
I mentioned earlier that it’s not just the level of sales and earnings that drives market prices, but also their rate of change. In my March Earnings Insight article I introduced the “silver lining for 2016.” The further 2015 earnings declined, the lower the bar became for realizing a higher 2016 earnings growth rate. Understanding this basic relationship is vital to investment success.
This silver lining has finally arrived.
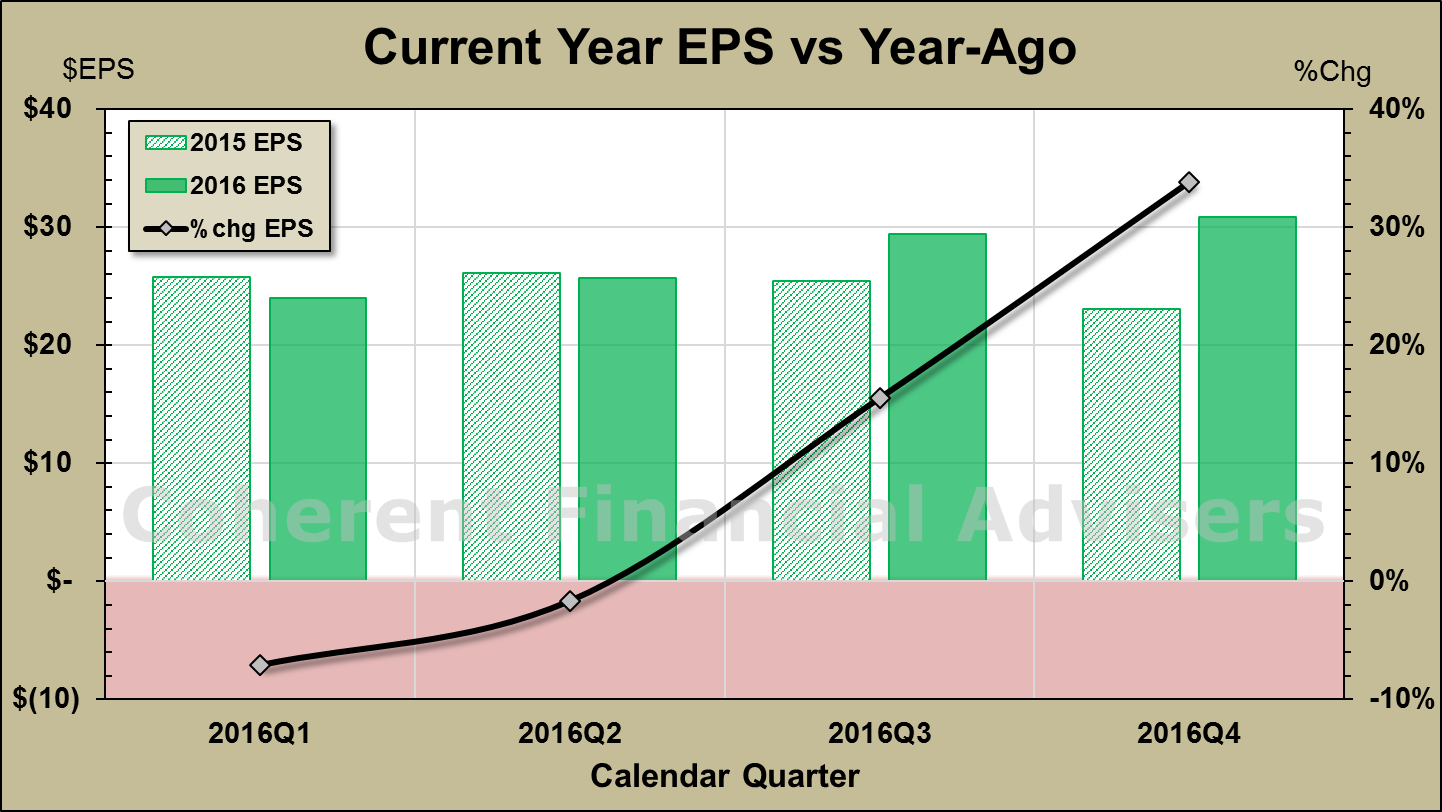
The chart above places each quarter’s earnings in 2016 next to that of 2015. For instance, 2016 Q1 earnings growth contracted because it was less than in 2015. As 2015 earnings continued to decline, it became easier to show strong positive growth in 2016, relatively speaking.
But in absolute terms, finishing 2016 at $110 operating earnings puts us no further ahead than where we were in mid-2015. It’s like running the 110-meter hurdle over consecutively shorter hurdles. Each hurdle becomes easier to clear by an increasing margin without jumping any higher.
As Rodney Dangerfield said, “I found there was only one way to look thin: hang out with fat people.”
Warm regards,
Sargon Zia, CFA
November 17, 2016
You are welcome to comment!
Published quarterly, Earnings Insight provides an analysis and summary of material trends in company earnings reports as interpreted by the author and Chief Investment Officer of Coherent Financial Advisers.
Footnotes:
- Data source: S&P Dow Jones Indices, us.spindices.com as of October 31, 2016, 61% of S&P 500 companies having reported third quarter earnings. Values are rounded for ease of reading. Analysis and interpretation provided by Coherent Financial Advisers, LLC.
- We want to pay attention to real and recurring drivers of company growth, looking past the non-cash and accounting related practices. Therefore, we have chosen to analyze operating data where possible, rather than as-reported figures usually cited. Numbers are rounded for ease of reading.
- Blended estimates combine actual reported earnings with estimates for those companies not yet having reported.
- Factset Research Systems, www.factset.com, November 11, 2016
- Data provided per Factset Research Systems, looking at the average change in the price of its stock two days before a company reported actual results through two days after it reported, a 4-day window.
- Margin: Expenses are typically measured in terms earnings left over from sales. Given sales of $100 per shares, and $92 of expenses, margins would be 8% or $8 per $100 of sales. Increasing margins means decreasing expenses, given a certain level of sales.