Managing Your 401k Part 1
If you have a retirement plan account such as a 401k, 403b, or 457b, then like most people you probably have several questions about managing your plan’s investments. In my experience, most people just don’t know where to begin. What’s typically lacking is a well-defined process, or possibly investment knowledge and experience.
“There is a logical, rational, and simple approach to selecting your investments and allocating money to them.”
Managing your retirement account should be approached from both a financial planning and an investment management perspective. In this three-part series, I describe some important aspects of designing your retirement account from an investment management perspective. Though by no means a comprehensive tutorial, I hope you will find it enlightening.

Stop The Pain
People often approach the task of selecting their retirement fund investments like constructing a multi-topping pizza from menu written in a foreign language with no pictures. Select a few securities based on last year’s performance, buy an equal or some other random amount of each fund, log out, pop open a “beverage” and watch the game. Phew! Glad that’s over!
People just want to stop the pain, and I know how that feels. If you have a choice of eight stock funds, how do you know which ones to select? There is a logical, rational, and simple approach to selecting your investments and allocating money to them. At Coherent, we have honed the process of understanding best in class investment choices from a limited menu offered by your company plan.
In this series, we will cover:
- First Things First
- Designing your bond portfolio
- Designing your stock portfolio (series part-2)
- Using target date and balanced funds (series part-3)
Start At The Beginning
Before we begin designing our portfolio, we need three items:
- The target asset allocation
- An appropriate benchmark
- Our retirement plan’s list of fund choices
A comprehensive financial plan will provide guidelines for designing your retirement account’s target asset allocation1. Without this plan, we are working blindly and incoherently. Let’s assume that your plan calls for a specific retirement account having 70% invested in the stock market (equities), and the remainder in bonds (fixed income). The time horizon for this account is more than 20-years out.
A well-considered benchmark serves as a “market-neutral” reference point, a valuable guide for allocating dollars to asset classes. We can then decide whether to deviate from this benchmark based on market conditions. The benchmark’s theoretical performance2 serves as a reference for measuring our account’s relative performance and attributing sources of excess return.
Regarding the 70% stock portion of our portfolio, suppose we decide to invest 70% of it within the U.S. and 30% internationally. For our exercise, we construct a 70% stock and 30% bond benchmark using three indices:
- 49% Russell 3000 Index3 representing the U.S. stock market
- 21% MSCI ACWI ex-US IMI Index4 representing the international stock market
- 30% Bloomberg Barclays US Aggregate Bond TR USD Index representing the U.S. bond market
Finally, we must assemble fact sheets for each of the funds which the plan administrator has made available within our retirement account. Some fund information is usually available on the plan website. At Coherent, one of the professional data services we use in designing portfolios is Morningstar® Advisor Workstation5.
We can now begin to construct our desired allocation within the retirement plan’s fund limitations. We will design the stock and bond portions of our account allocation as two separate portfolios, but the general principals are the same.
Designing Our Bond Portfolio
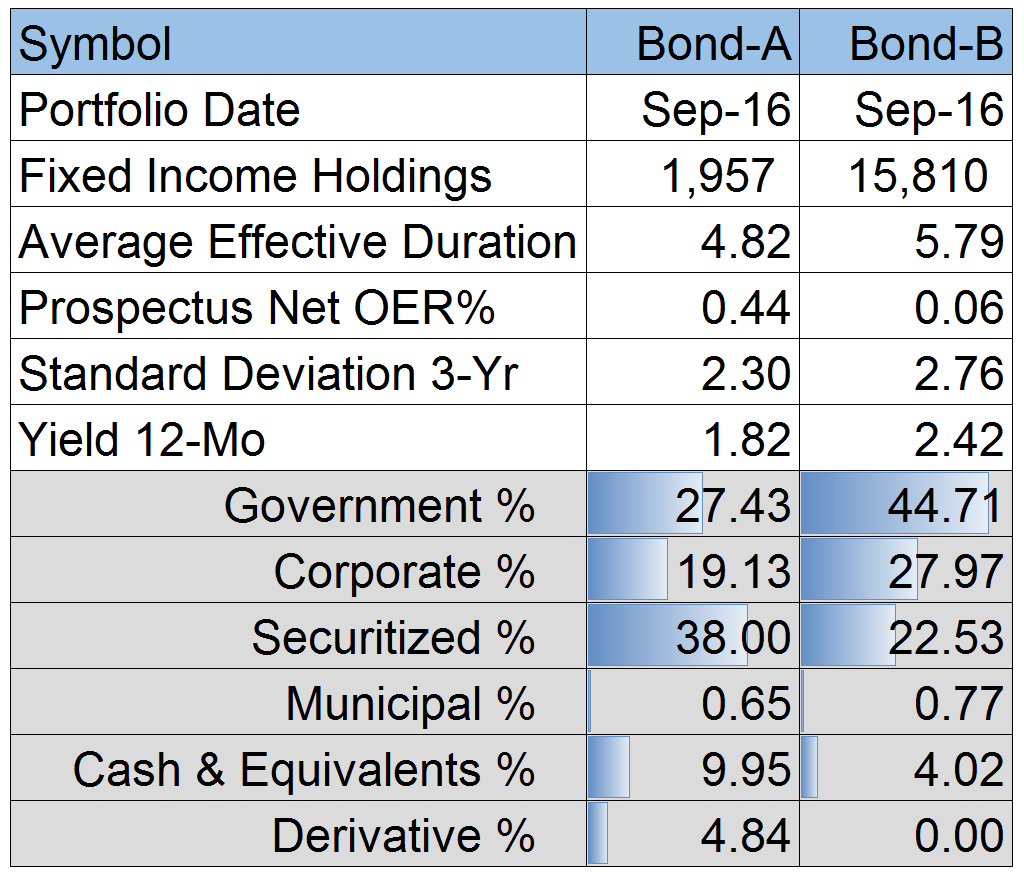
Suppose our hypothetical company plan offers only two bond funds, Bond-A and Bond-B. We assemble this fund summary (figure-1) from data in our fact sheets.
Based on Morningstar’s data, Bond-A has a lower duration and yield, and tilts more towards securitized bonds versus government and corporate. Its gross operating costs are $44 per year for every $10,000 invested compared with Bond-B’s $6. Meanwhile, Bond-B tracks closely with our benchmark bond index.
This limited choice reduces our work to one simple question. If Bond-B tracks closely with our benchmark bond index at a much lower cost, why even bother considering Bond-A? The answer is Bond-A’s consistent outperformance net of expenses. Let’s investigate this in more detail.
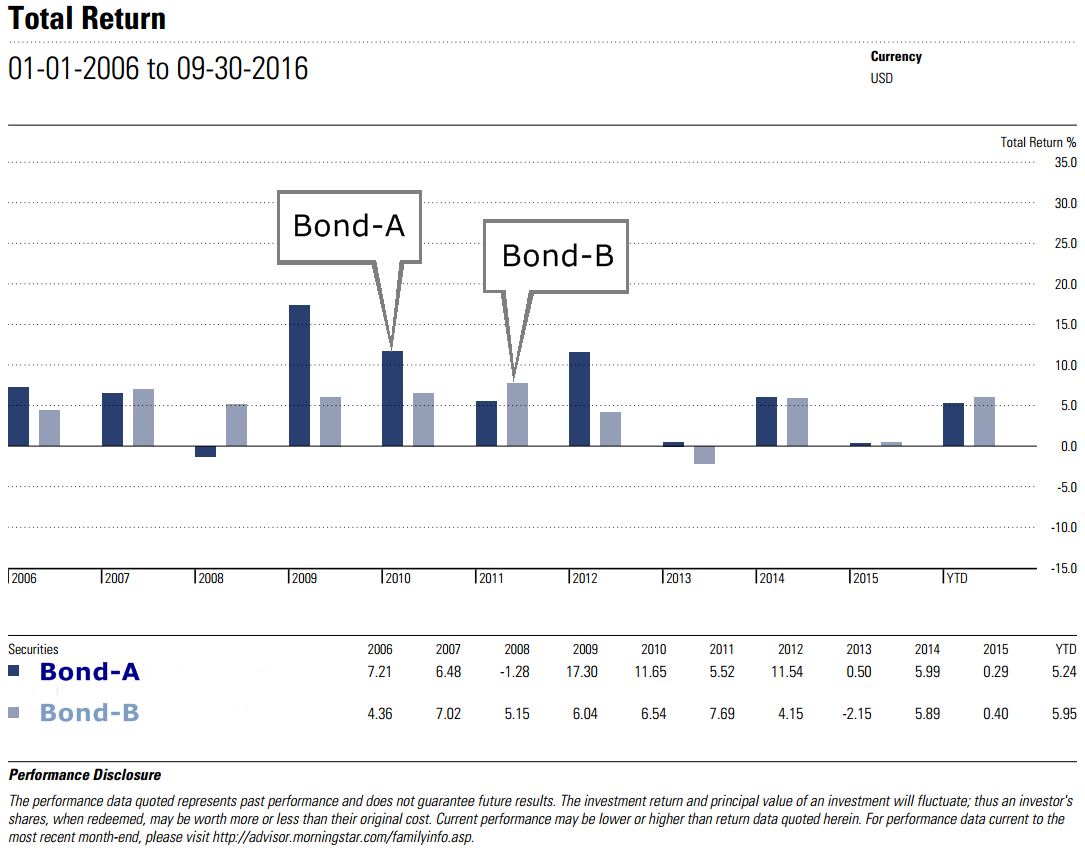
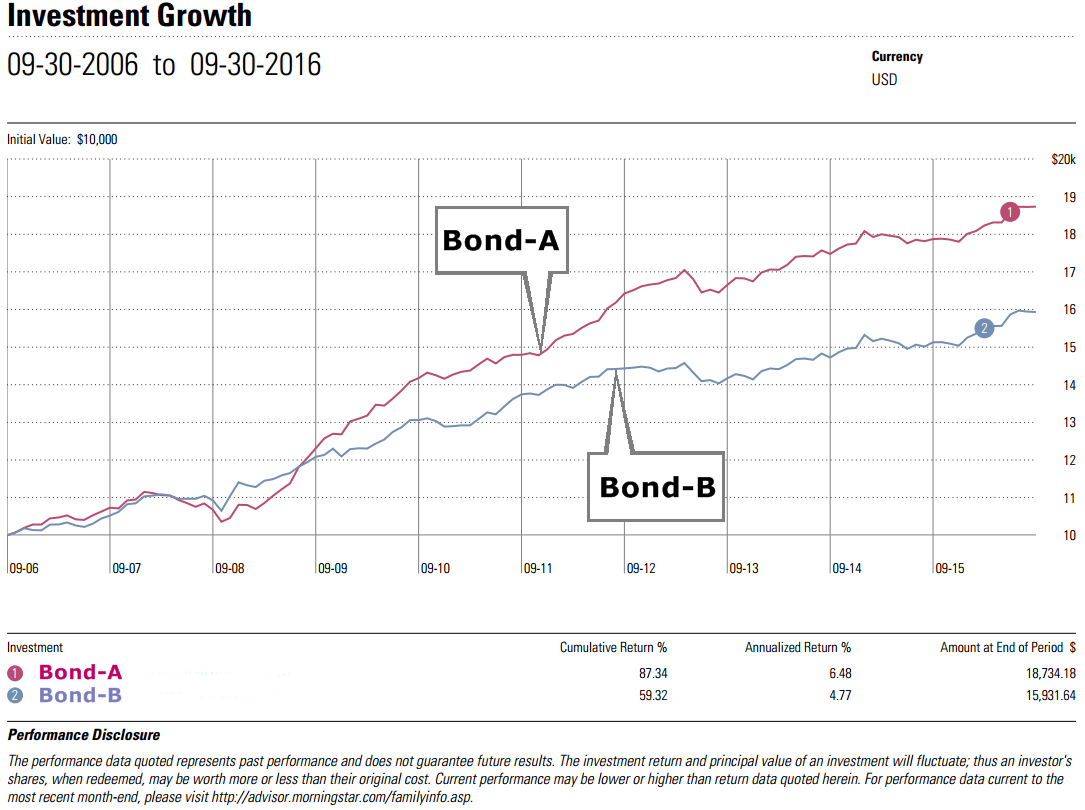
Bond-A outperformed in most years, sometimes by more than a 10% margin (figure-2). A $10,000 investment in Bond-A over this 10-year period, dividends and capital gains reinvested, grew to $18,734 net of expenses (figure-3), compared with $15,931 in Bond-B.
The better question
The better question here is not which fund is cheaper, but rather is Bond-A’s $2,803 excess return over 10-years worth the extra $380 of operating expense? You don’t need a calculator to figure that one out.
In the absence of value, then price is the only issue. When all you have is a hammer (e.g. low cost funds), then every problem looks like a nail. That’s clearly not the case here. Bond-A has consistently delivered a higher return net of expenses over the past 10 years. Did this outperformance come at the expense of disproportionately higher volatility?
“In the absence of value, then price is the only issue.”
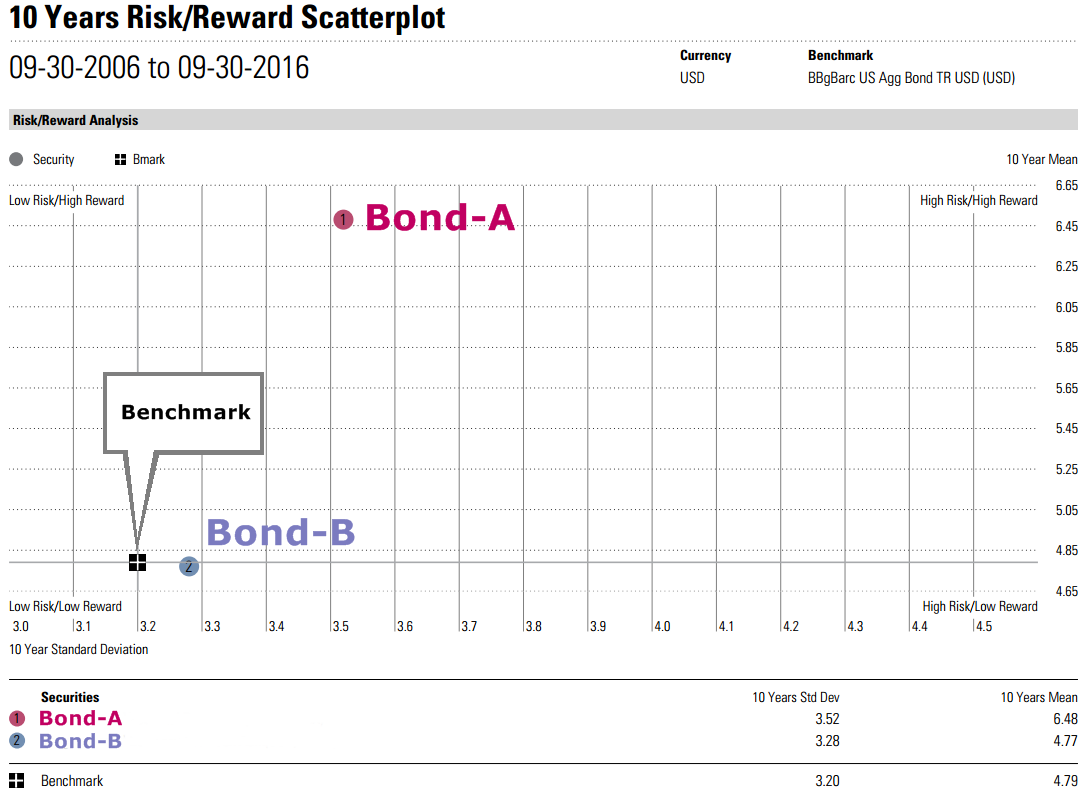
No! In fact Bond-A’s outperformance came at nearly the same volatility on average over 10 years as that of Bond-B. This can be seen quite dramatically in the risk/reward plot shown in figure-4. Bond-A delivered on average 1.71% more annualized return (net of its .38% higher expense) at only 0.24% more volatility in terms of annualized standard deviation. In financial terms, Bond-A delivered a relatively higher risk-adjusted return.
You might be wondering then if Bond-A has delivered higher total return net of expenses at negligibly higher volatility, why not just use Bond-A for our 30% bond portfolio? That’s a good question, and it deserves a good answer.
I prefer to measure performance not in absolute terms, but relative to a relevant benchmark. Bond-B (“B” for benchmark) tracks the benchmark closely by design – it’s the fund manager’s mandate. Anchoring our fixed income portfolio in Bond-B and adding Bond-A for “alpha” provides a safer, more diversified approach in the longer term.
There are scientific methods for optimizing the allocation between Bond-A and Bond-B. But let’s dispense with the rocket science for a simpler guideline: allocate at least 40% of the 30% allocated to fixed income to Bond-B, and at least 20% to Bond-A. For example, allocating 20% of our total account value to Bond-B and 10% to Bond-A falls within this guideline.
Designing Our Stock Portfolio
We’ve covered some important and generally applicable principals in this first article. We will discuss the stock portfolio in our next issue, adding to the principles we learned here. We will also discuss aspects of using target date and balanced funds. Meanwhile, I invite you to read Tom’s article, Maximizing Benefits During Open Enrollment.
If you have any questions or comments, you are welcomed to use the public comment section at the bottom of this article from which others may benefit. Or feel free to use our contact page to send me your questions privately.
Warm regards,
Sargon Zia, CFA
October 27, 2016
You are welcome to comment!
Recommended reading:
Managing Your 401k Part 2
Managing Your 401k Part 3
Footnotes:
- Target asset allocation: the percentage of your account allocated to each broad asset class, such as equities, fixed income, commodities, cash, etc. An actively managed portfolio may adjust allocations around this target based on market conditions.
- Our benchmark is composed of indices which do not incur real-world expense such as management fees, transaction costs, and other operating expenses which handicap performance. Our benchmark’s performance is for reference purposes only. You cannot directly invest in an index.
- The Russell 3000 Index includes about 3,000 companies, covering about 98% of the US stock market, including small-caps. The S&P Index includes about 500 companies, covering about 80% of the US stock market, excluding small-caps. See also www.ftserussell.com/ and us.spindices.com/.
- As of this writing, the MSCI ACWI ex-US Index captures large and mid-cap representation across 22-23 Developed Markets countries excluding the US and 23 Emerging Markets (EM) countries. With 1,853 constituents, the index covers approximately 85% of the global equity opportunity set outside the US. See also www.msci.com/.
- The information contained herein: (1) is proprietary to Morningstar and/or its information providers; (2) may not be copied, adapted or distributed; and (3) is not warranted to be accurate, complete or timely. Neither Morningstar nor its information providers are responsible for any investment decisions, damages or losses arising from any use of this information or any information provided in conjunction with it. This report is for information purposes only, and should not be considered a solicitation to buy or sell any security. Past performance is no guarantee of future results.