Worst Month – September Or October?
Is October the worst month of the year for stocks, or has it taken the blame for September? Sensationalism is a mainstay of articles on seasonal or calendar investing. We’ll take an objective, Coherent approach to stock market seasonality.
“October: This is one of the particularly dangerous months to invest in stocks. Other dangerous months are July, January, September, April, November, May, March, June, December, August and February.”
– Mark Twain
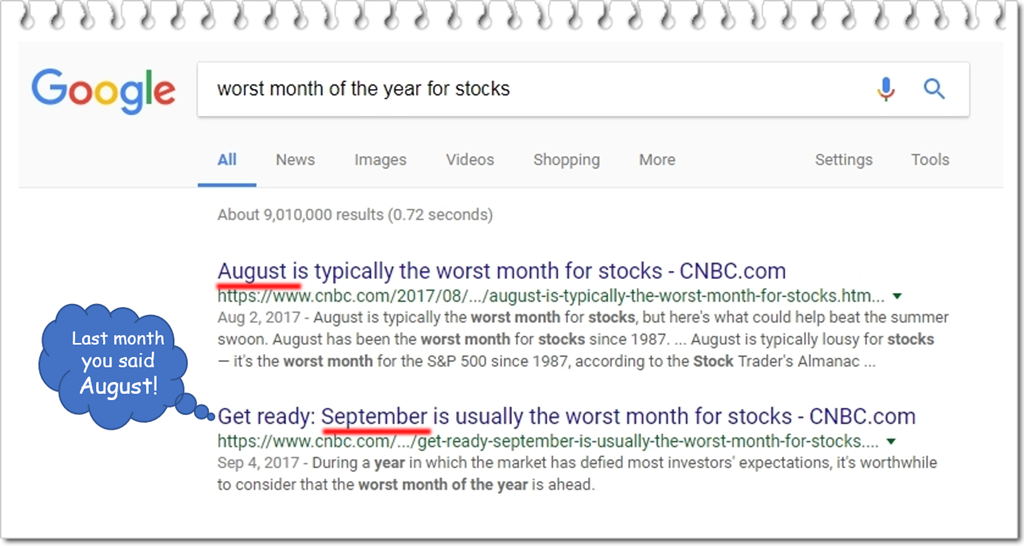
As part of my research for this article, I googled “worst month of the year for stocks”. Page-1 yielded these two consecutive results in figure-1. Note that they are posted one month apart by the same source. I guess it depends on their definition of usually and typically. I can’t wait to see which adverb will be featured in their October article. Perhaps facetiously!
In this Coherent Investor series article, we revisit the topic of stock market seasonality1. In our usual objectively scientific manner, we address the question, “Which month is the worst for stocks?”
- Beware! The Pitfalls Of Stock Market Seasonality Claims
- September – The Worst Month Of The Year For Stocks
- Why Some Believe October Is The Worst Month
- Closing Thoughts
Beware! The Pitfalls Of Stock Market Seasonality Claims
Mr. Beard’s twins, Blue and Red, are studying for final exams. To assess their readiness, Mr. Beard gives each twin five practice exams. Blue averages 72.2% and Red 73.0%. The passing score is 70%.
Question: Based only on the average scores, who will pass the exam with 95% certainty?
-
A) Both will pass the exam
B) Red, with a higher certainty
C) Insufficient information
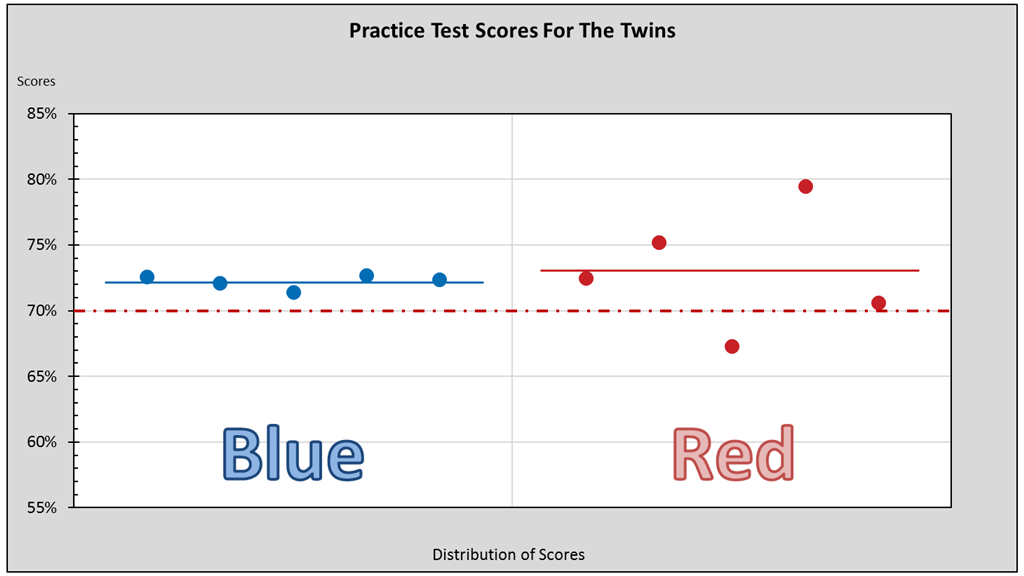
Now consider figure-2 showing each twin’s individual test scores (dots) and average score (solid lines). If you answered “C”, you were correct!
The average score combined with the variation between test scores indicates that Blue will pass with almost 100% certainty while Red has an 11% chance of failing2.
An average alone is insufficient information for making a correct assessment with any objective degree of certainty.
The average value alone is insufficient
The story of Mr. Beard’s twins illustrates a common failure of seasonality studies. I discussed several errors also in the article describing how the January Barometer is flawed.
A common mistake is comparing only averages, while failing to…
- address outliers
- incorporate variability
- define certainty
- determine the correct “zero”
Averages are highly sensitive to outliers which must be properly addressed. Two months with the same average return can differ in their spread or variability between returns. Considering averages and variability together helps to objectively determine to what level of certainty differences might be significant or simply random.
Zero is not always “zero”!
Perhaps the most egregious mistake
Zero is not always “zero”! In our story, a score above 70% is passing. That’s our zero. Likewise, a positive month is not always any return above zero! It depends on the context. This is perhaps the most egregious mistake I see made in stock market seasonality claims.
Let’s now consider the question of which is the worst month of the year for stocks.
September – The Worst Month Of The Year For Stocks
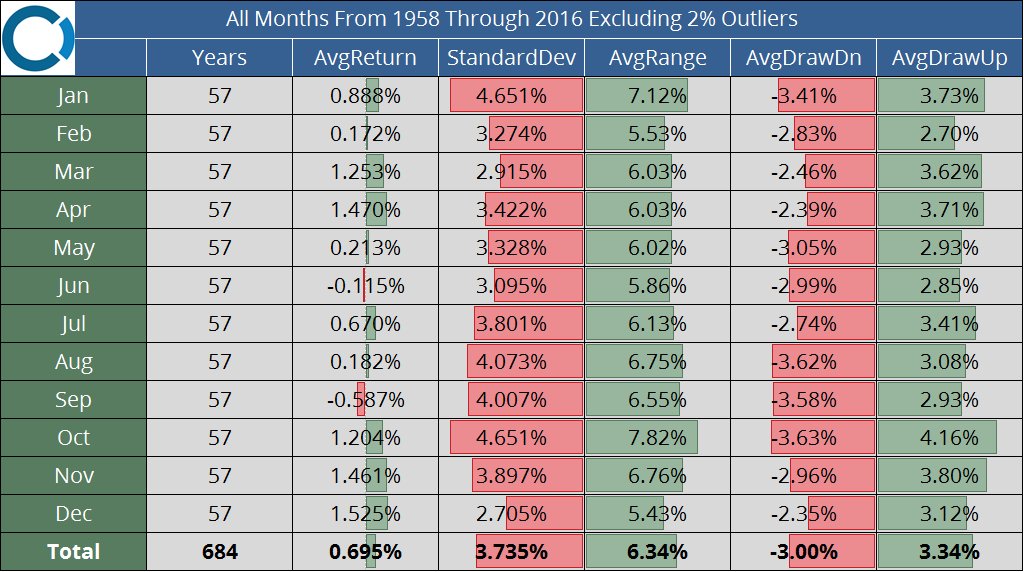
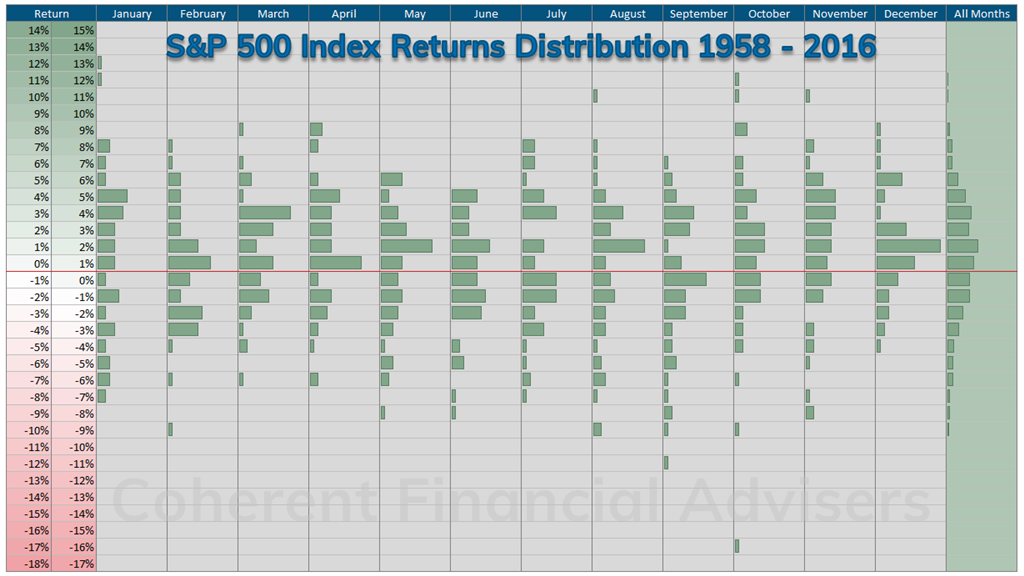
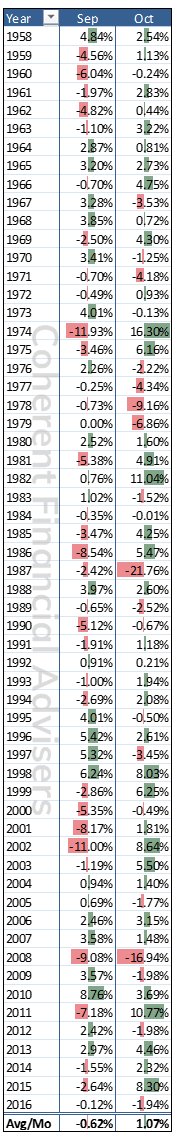
Coherent’s independent study4 is summarized in figure-3 and figure-4. During the 59-years3 from 1958 through 2016, September has been the worst performing month of the year for stocks. October is distinguished by its high variability or volatility of returns, which diminishes its otherwise positive average performance.
Coherently frame the question and you will have won half the battle.
The key question is, “What is a positive or negative return?” In our context, it is a return which is significantly above or below the average return for all months in our dataset. This relevant reference point is 0.7%…that’s our zero!
We will define “certainty” as being 95% confident that a month’s average return is truly above or below 0.7%. This requires that we incorporate each month’s performance variability after properly addressing outliers.
The September stock market – first place for worst
September has lost 0.6% on average, or 1.3% points below our 0.7% reference. This wide spread is statistically significant despite September having the fourth highest volatility. At 95% certainty, September is the only negative month, while December is the only positive month. At 98% certainty September is the only month not randomly average.
September is the only month not randomly average at 98% certainty.
Excluding outliers, September drawdowns5 averaged 3.6%, tying October for worst place. September’s worst drawdown was 16.7% in 2001, one of four years exceeding 10%. But month to peak September exceeded 10% only once in 1998, and ranks ninth with a positive 2.9% average.
The October stock market – the bipolar month
October has gained 1.2% on average, or 0.5% points above our 0.7% reference. But October has the highest volatility (tied with January). This renders October’s performance randomly average. Calling October a “positive month” is accepting a 42% probability of being wrong. Claiming it’s negative, let alone the worst, is 100% incorrect.
Calling October a positive month is accepting a 42% probability of being wrong. Claiming it’s negative is 100% incorrect.
Excluding outliers, October has the worst single drawdown of all months, a whopping 28% in 2008. But its average 3.6% drawdown is on par with four other months. October also claims the highest month to peak return on record, and on average. This speaks to its volatility, which is why I call October “the bipolar month”.
Why Some Believe October Is The Worst Month
In my experience as a senior registered representative, portfolio manager, and investment adviser, the belief that October is the worst month of the year persists among investors. I can speculate on a few reasons why.
October displays the most volatility of all other months of the year. Stock Trader’s Almanac6 reminds us why October is known as the “jinx month” citing crashes in 1929, 1978, 1979, 1987, and 1997. This aggravates October’s reputation.
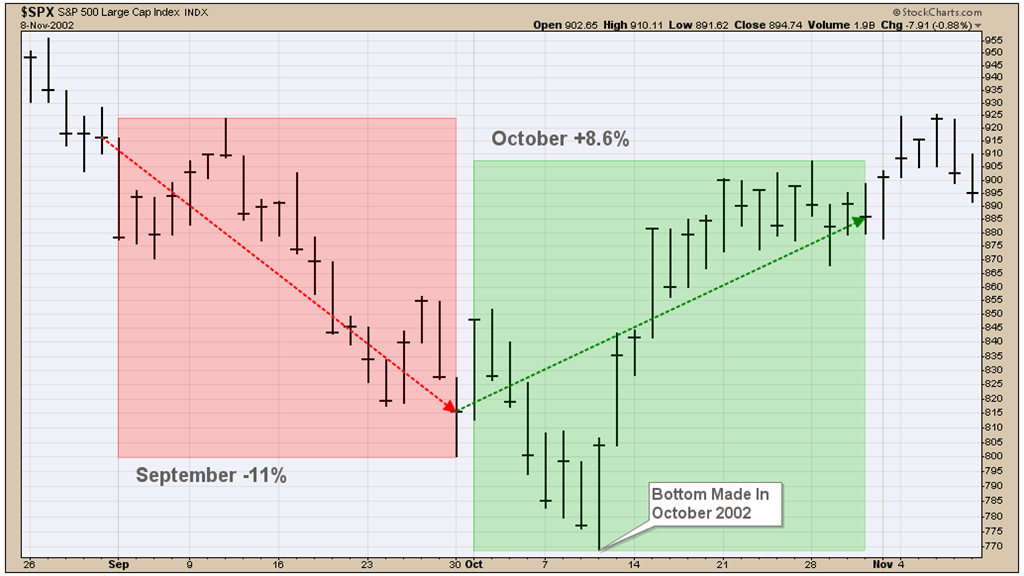
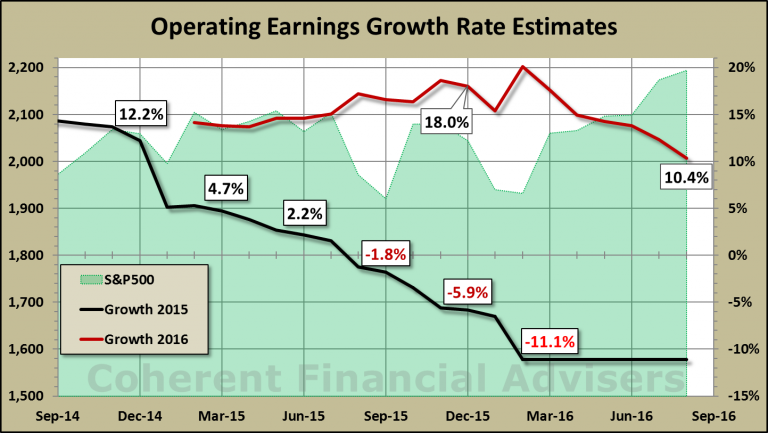
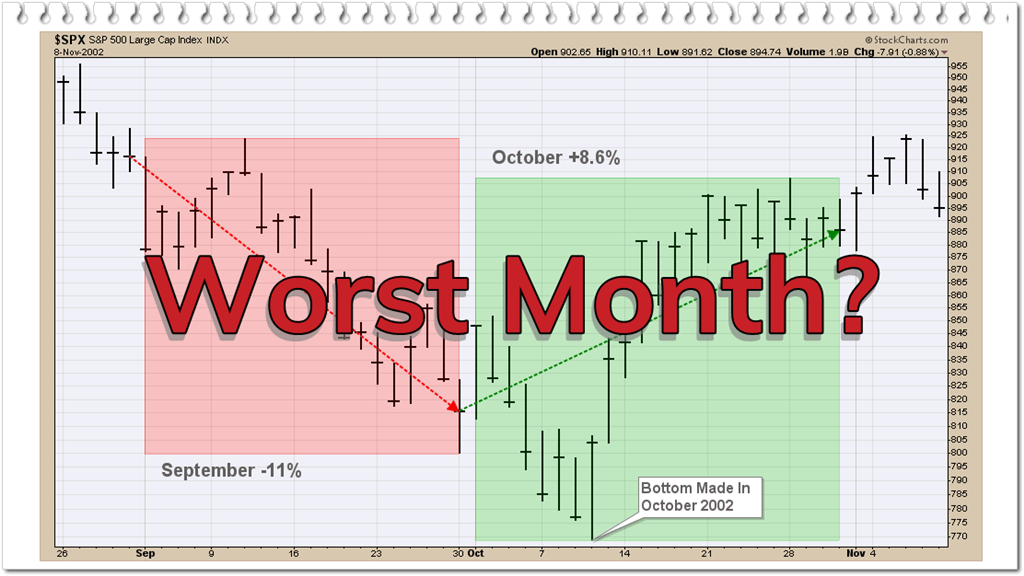
Emotionally, a loss can have two and a half times the impact as a gain of the same magnitude7. Corrections through September are likely to end in October (figure-5). This point of acute pain is projected onto all October.
Another contributing behavioral bias is conservatism due to anchoring and adjustment. People do not revise and adjust previously held beliefs sufficiently in response to new information. A person hears for the first time and believes that October is the worst month. Subsequent facts to the contrary may take the person only part way to believing otherwise.
“A lie can travel half way around the world while the truth is putting on its shoes.”
– Mark Twain
Perhaps the simplest reason is that it is so often repeated. Like bad news, inaccurate information seems to travel so much faster. The plain truth is that it takes time and energy to gather, structure, and analyze data properly in relation to a hypothesis. It is far easier to write sensationalism, regardless of accuracy.
Closing Thoughts
At Coherent, we conduct our own independent research and analysis in a rational and objective manner. Faulty science is an all too common failure of seasonality claims. We showed this when vetting the January Barometer and the Sell in May myth.
September is the worst of all months for stock market returns. But the market’s overall trend has a significant bearing on stock market seasonality. Our study showed that in years the market returned above 1%, September averaged 1.37%. And in years the market lost more than 1%, September averaged -6.57%.
I hope this article has demystified the worst month of the year. And I hope you’ve enjoyed our approach to addressing questions about investing in general.
How can we help you?

Do you need help with financial planning, investment management or benefits guidance? Contact us for a complimentary call. We look forward to discussing your unique financial goals and personal values!
Warm regards,
Sargon Zia, CFA
September 18, 2017
You are welcome to comment!
Recommended Articles:
Vetting The January Barometer
Sell In May Depends On Trend
Stock market seasonality
Published regularly, the Coherent Investor series focuses on the current conditions of the securities markets as interpreted by the author and Chief Investment Officer, unifying multiple investment disciplines including fundamental and technical analysis.
Footnotes:
- Cyclicality and seasonality are two entirely different concepts. Cyclicality examines the periodic oscillations simultaneously present in the financial markets. It draws upon techniques and mathematics prevalent in signal processing. Seasonality studies the effect of calendar seasons on market returns. This is discussed in What Moves The Market article.
- This example was based on two sets of 5-random numbers. Blue averaged 72.2 at s=0.52. Red averaged 73.0 at s=4.63. A 1-tailed hypothesis test with H0<=70, and Ha>70 yielded Blue p-value=.033%, Red p-value=10.9%.
- The “Composite Index” began tracking a small number of stocks until finally expanding to 500 individual US companies in March of 1957, and becoming the “S&P 500 Index” we know today. To ensure that our results would not be skewed due to index construction, we selected S&P 500 Index monthly price returns for the 59-years from 1958 through 2016.
- We applied commonly accepted statistical methods to generate objective results. Outliers in the top and bottom 1% of the sample were removed for each month independently. This yielded 57-years of monthly returns, totaling 684 samples averaging 0.70%, becoming our reference point for the null hypothesis. The null hypothesis: a month’s average return for all years is equal to the average return for all months, all years. The alternate hypothesis: a month’s average return is not equal, hence a 2-tailed test. September’s p-value = 1.8% and October’s p-value=42.1%. For discussion purposes, we used the standard 5% significance level to calculate William S. Gosset’s “Student’s t” distribution. We also supplied the probability for the observed t-scores, or p-values, to quantify the chance of a false positive.
- Specific to our context, drawdown is measured from the previous month’s close to the current month’s trough.
- Hirsch, Jeffrey A. and Yale (2016). Stock Trader’s Almanac, Hoboken, NJ: Wiley & Sons, pg 90.
- From Daniel Kahneman and Amos Tversky’s landmark work on prospect theory, and the loss aversion phenomenon, 1979.