Vetting The January Barometer
As January comes to a close, you will no doubt hear someone quote the January Barometer – “As January goes, so goes the year.” January is looking good so far this year, so 2017 should end positive, right? But is this real research or fake science? At Coherent, we vetted this theory and share our findings with you.
“The classical January Barometer is flawed from the word ‘goes’.”
The January Barometer is a creation of Yale Hirsch in 1972, featured in his Stock Trader’s Almanac1. According to co-author Jeffrey Hirsch2, “Our flagship indicator … simply states that as the S&P goes in January so goes the year.” Meaning: January’s move is often followed by a move in the same direction for the whole year. Several flaws undermine this theory as traditionally defined. Let’s recalibrate our thinking process regarding the January Barometer.
- How the classical January Barometer is flawed
- What we learned from our own comprehensive study
- Why investors should be wary of seasonality claims

How The January Barometer Is Flawed
The scientific method states that we make an observation, ask a question, form a hypothesis, conduct an experiment, and either accept or restate our hypothesis. In this respect, the classical January Barometer is flawed from the word “goes”. The question is ambiguously framed, the experiment is poorly designed, and the hypothesis is biased. But other than that!
“Asking the right question is key to discovering the right answer.”
Ask the right question:
I have found that asking the right question is key to discovering the right answer. It “goes in the same direction.” So what? The typical investor is paid by both direction and the amount of market movement. Variability of returns, a crucial factor often missing from seasonality claims, greatly influences overall success.
Form a rational hypothesis:
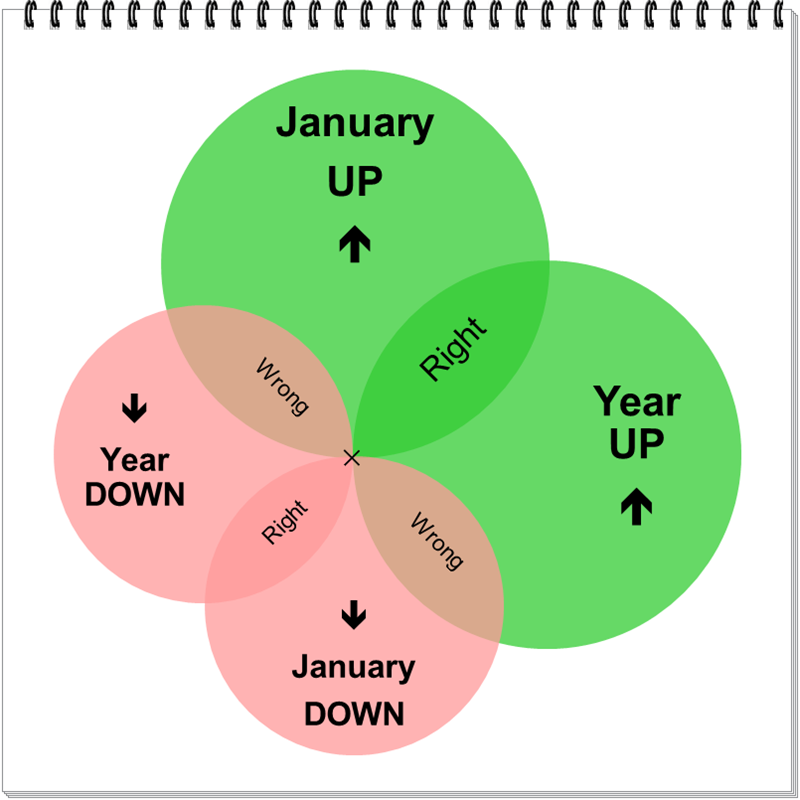
A hypothesis is one possible answer whose veracity will be tested. The classical theory defines up and down relative to zero rather than the sample averages. A zero-crossing reference biases our results by moving wins from the down/down to the up/up condition. The barometer’s overall success may not be appreciably affected, but your trading success can be.
For instance, a +0.9% average of January returns is singularly independent of all full year returns. Similarly, an 8% average full year return is independent of any individual January return. Using average-crossing mitigates erroneous conclusions.
“Variability of returns, a crucial factor often missing from seasonality claims, greatly influences overall success.”
Conduct a reasoned experiment:
A glaring flaw in the classical experiment is that the experiment injects the predictor (January) into full year results. This biases the outcomes in the barometer’s favor. Knowing the outcome of one coin flip in advance of two tosses inflates the predictive accuracy from a random 25% to an exaggerated 50%.
The 2016 Almanac1 boasts an 87.7% accuracy ratio. Compared to what? Zero? 50%? 80%? The random probability of success3 is missing. But isn’t 87.7% accuracy good regardless? It depends on your definition of “good”. Proper hypothesis testing incorporates variability metrics to distinguish real from randomly occurring results.
These flaws render the classical January Barometer ineffectual. Let’s redefine and retest a modified version of the January Barometer designed to overcome these shortfalls.
A Coherent Study Of The January Barometer
The observation is that January and full year returns seem positively correlated. Coherently framing the question wins half the battle. Given S&P 500 Index price data over a sample period, is there a quantifiable and significant relationship between January returns and the rest of the calendar year from February through December?
We presume or hypothesize that there is no relationship, linear or otherwise. A sound experiment will yield objective results so we can either accept this assumption, or fail to accept it in favor of the alternative – that there is a relationship. In either case, we are obliged to describe and quantify it. Notice that I was careful to avoid using terms like “reject” or “prove”.
“January has little if any useful predictive value. If this were a real barometer, I would say it’s busted.”
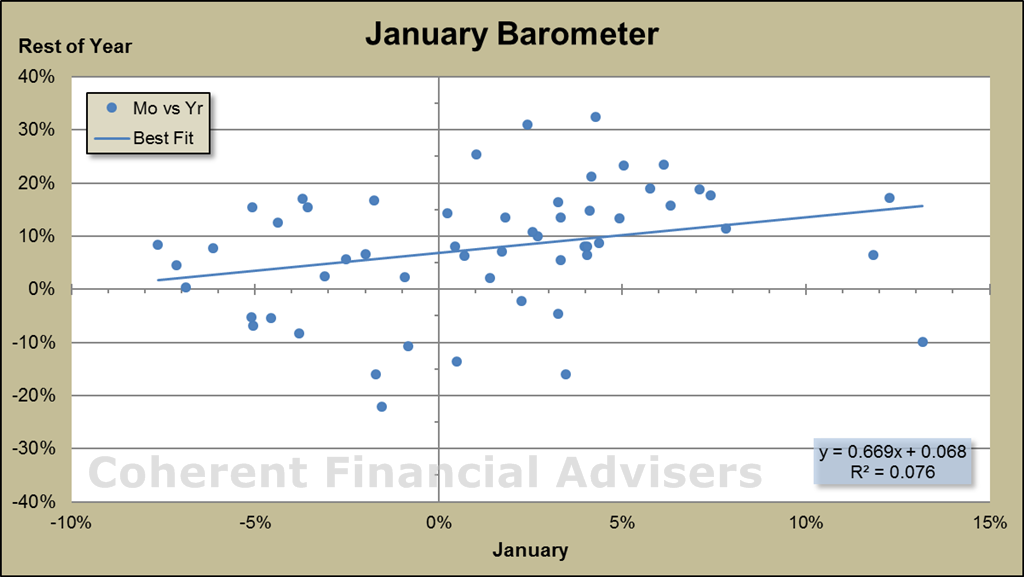
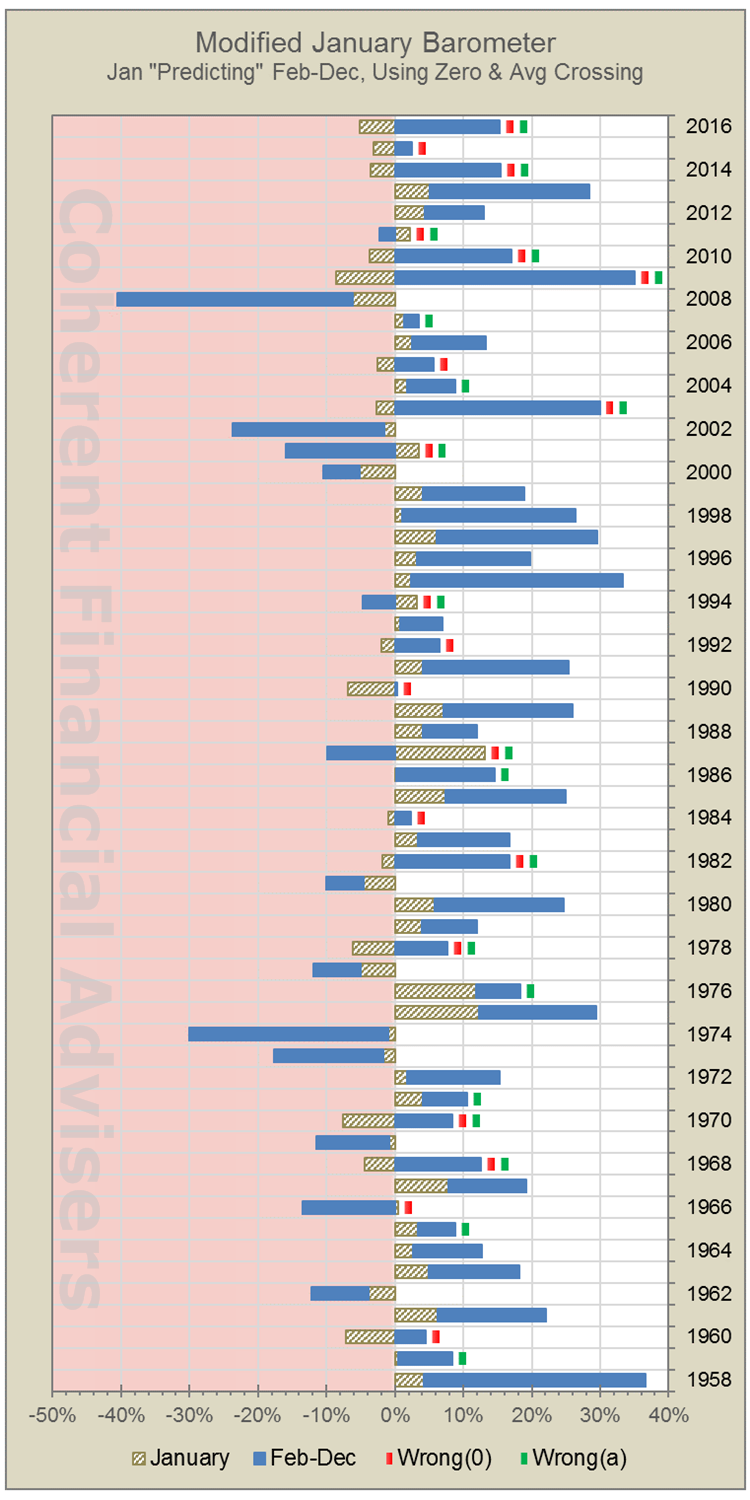
Our study used 59-years of monthly data from 1958 through 2016 for good reason4. We applied commonly accepted statistical methods to generate more objective results. We describe the relationship both visually as in figure-3, and mathematically as follows.
Will the foreman please read the verdict!
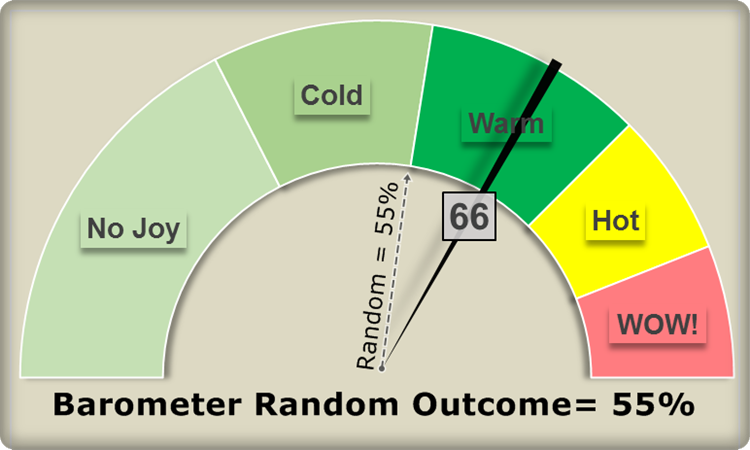
While our results confirmed a positive linear relationship5, the degree was minuscule. Without removing four outliers, there would be no detectable relationship at all! Our modified January Barometer scored 66.1% “accuracy” relative to 50.3% random chance. But wait, there’s more!
January returns explained only 7.6% of the returns for the rest of the year6. This leaves 92.4% of remaining calendar returns unexplained by January. Correlation between returns was a mere +0.275, where zero means no correlation and one means full positive correlation.
Therefore, it is my opinion that January has little if any useful predictive value. If this were a real barometer, I would say it’s busted.
In case you’re wondering, if this January closes up 3%, the regression model indicates the remaining year will be up another 8.8% – plus or minus a couple pounds of salt. The classical definition posits simply that the year will be “up”.
Why Investor Should Be Wary Of Seasonality Claims
The January Barometer is a venerable indicator among the financial media at large. We are subjected to it every year at this time. My advice is to ignore it. Think about it. If January is a “flagship indicator” with 87% accuracy as touted by its authors, we could all wait till February, invest as predicted, and go golfing for eleven months. At least I can. I live in Arizona!
“Faulty science is an all too common failure of seasonality claims.”
Faulty science is an all too common failure of seasonality claims, like when we vetted the Sell in May myth. Remember that correlation does not necessarily mean there is cause and effect. The true cause may lie in something else related to both factors like, oh, the market’s trend for instance.
Warm regards,
Sargon Zia, CFA
January 27, 2017
Recommended Reading:
Sell In May Depends On Trend
What Moves The Market?
Coherent Investor: 2017 Possibilities
Coherent Investor: Market Trends
You are welcome to comment!
Footnotes:
- Stock Trader’s Almanac, pages 16-18, Jeffrey A. Hirsch & Yale Hirsch, published by John Wiley & Sons, Inc. See also stocktradersalmanac.com.
- Stock Trader’s Almanac blog, “January is laden with key indicators”, December 20, 2016. See stocktradersalmanac.com.
- If our sample had 100% up-Januarys, and 70% up-years, there exists a 70% chance of a correct outcome occurring randomly. Multiply the probability of an Up-January by probability of an Up-Year. Repeat for down/down and add the two products.
- The “Composite Index” began tracking a small number of stocks until finally expanding to 500 individual US companies in March of 1957, and becoming the “S&P 500 Index” we know today. This may matter little for our study. But we wanted to ensure that our results would not be skewed due to index construction. Otherwise, we could have included data from 1950.
- Our Coherent study used S&P 500 Index monthly price returns from 1958 through 2016, excluding outliers. February through December holding-period returns were regressed on January returns using cross-sectional, ordinary least-squares regression analysis (ANOVA). Four outliers were removed (1974, 2003, 2008, 2009), two each from the highest and lowest standardized errors of the estimate. While we found no strong argument for defining outliers, the experiment otherwise resulted in accepting the null hypothesis that there is no relationship. The regression model (Year = 0.0683 + 0.669Jan) was tested for bias. Correlation and regression coefficients passed 2-tailed significance tests at the 95% confidence level. Regressing actual returns on predicted values resulted in b1=1, b0=0. Residuals were fairly normally distributed, displaying little to no homoskedasticity. Residual correlation to predicted values was statistically zero, and regression yielded b1=b0=0. The coefficient of determination was 7.58%, the correlation coefficient was +0.275 with 4.2% p-value, and the regression intercept was 6.83% with 0.01% p-value.
- More technically stated, variation in January returns explained 7.6% of the variation in holding-period return for the rest of the same calendar year, from February through December. Conversely, 92.4% of the variation in calendar year returns remained unexplained by January, but rather were attributable to some other factors. Furthermore, a small but statistically significant correlation of 0.275 exists only when strategically removing outliers. Some or all of this correlation may be spurious, due to an attribute shared by all months, namely the market’s dominant long-term trend.