Earnings Insight February 2017
Coming from behind in Super Bowl LI, the New England Patriots shattered many long-standing records. The stock market’s long term price trend has also broken records, after correcting last year. Facing high growth expectations, companies must deliver spectacular earnings this year to justify current market prices. Are earnings expectations for 2017 reasonable or optimistic?
“Companies must deliver spectacular earnings this year to justify current market prices.”
About The Earnings Insight Series
Owners of common shares are called “residual owners” because they hold claim to net earnings, what’s left of revenue (sales) once all expenses are paid. Therefore, forward looking earnings estimates are an important part of earnings season, and a significant determinant of the stock market’s long-term trend.
In this Earnings Insight series, we focus on key revenue and earnings trends. Our analysis is based primarily on aggregate forward looking estimates1 of the S&P 500 Index revenue and operating earnings2. To capture the essence of earnings season, we bypass the minutia and focus on three high-level questions:
-
What are the market’s expectations for growth?
Are expectations grounded in a reasonable and rational basis?
How much expectation is already priced into the market?
In this article, we address:
- Reviewing 2016 earnings and introducing 2017 outlook
- The likelihood of achieving 2017 earnings estimates
- What this all means to the stock market’s price trend
Introducing 2017 Earnings Outlook
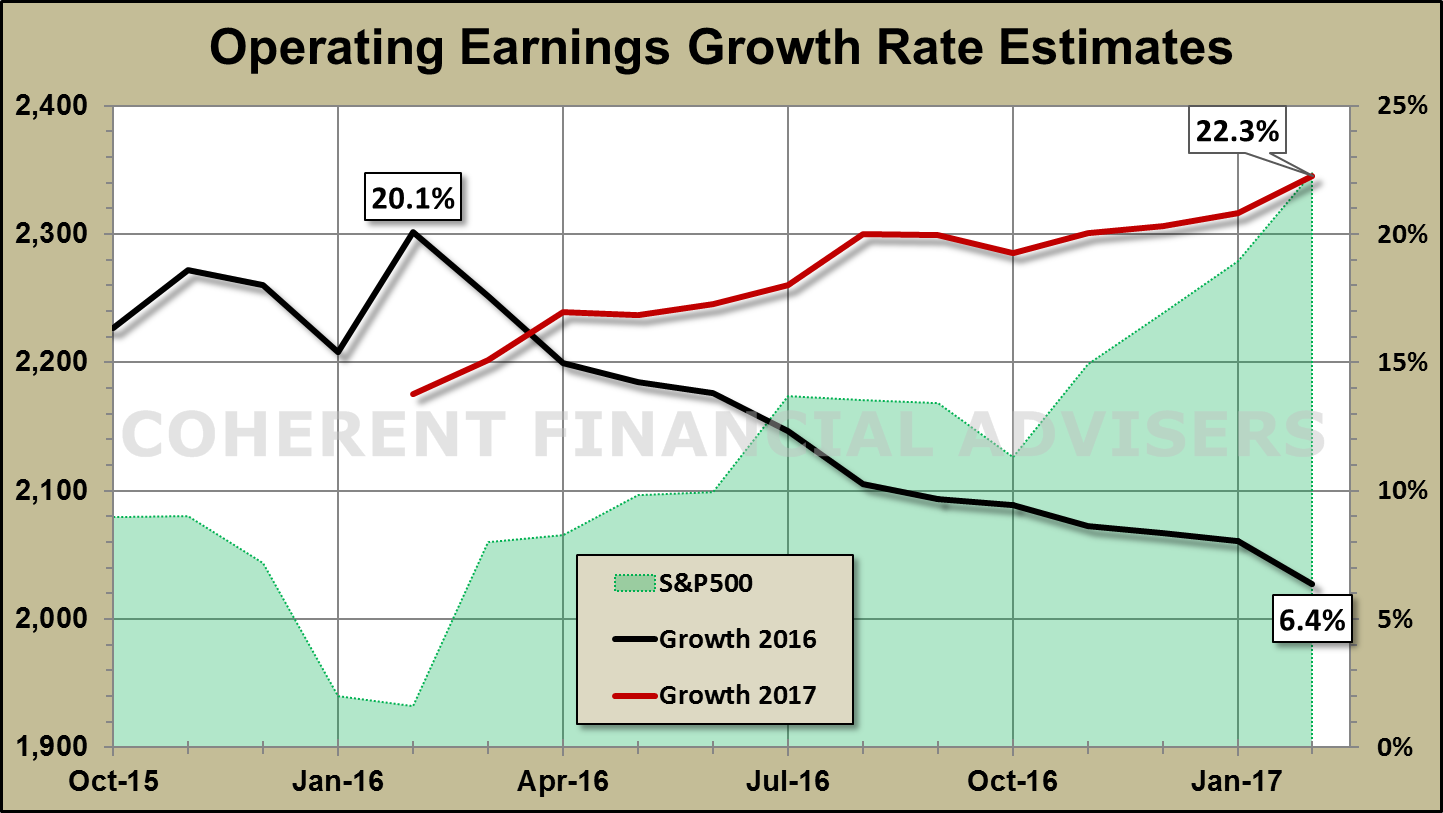
Reviewing 2016 earnings will help set the context. As of February 16, over 80% of S&P 500 Index companies had reported Q4 earnings, completing 95% of full year 2016. Last February, analysts had estimated 20% growth at $121 per share. Reality is closer to $107 for 6% growth (figure-1). Not stellar, but it’s better than 2015’s 11% earnings contraction. Maxwell Smart would say, “Missed it by that much.”
“The outlook for full year 2017 operating earnings is, brace yourself…”
Why did estimates miss actual earnings by that much? Notice I said estimates missed earnings, not the other way around. You often hear that a company “missed estimates”. That’s like saying a target missed the arrow.
The answer lies in understanding the basic elements that make up earnings which in turn drive the long-term market price trend. Earnings growth is determined by growth from sales and margins3, preferably sales. In my November Earnings Insight article, I introduced the Financial Periodic Table of Elements as it relates to the market’s price trend.
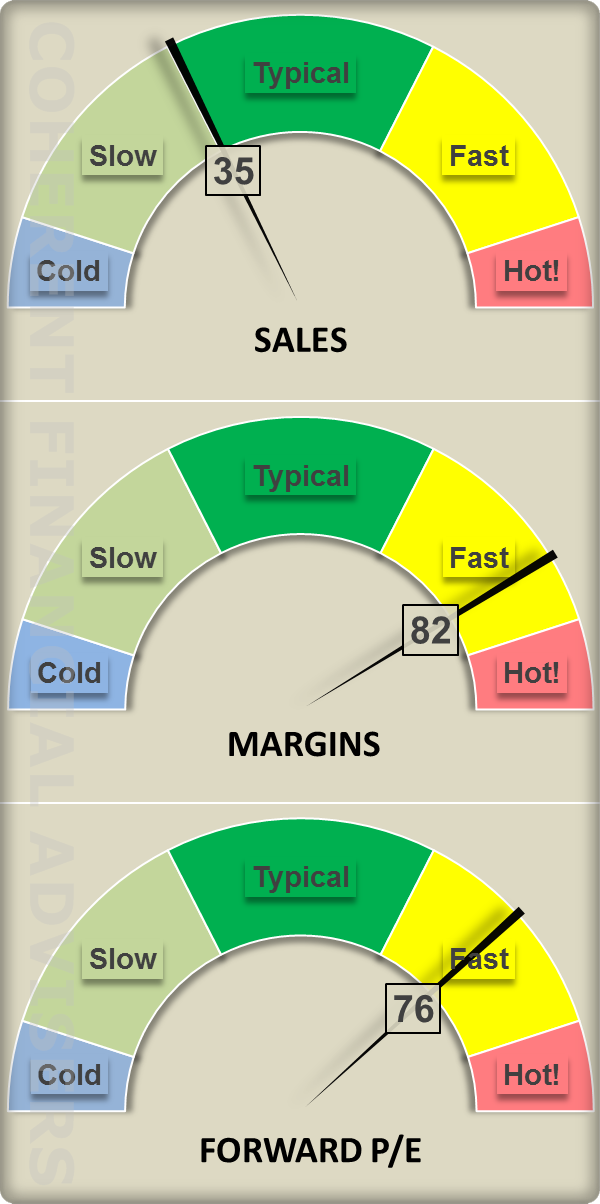
Figure-2 describes these elements for Q4. But during February last year, sales growth was at 21% of its historic range, margins 58% and PE 72%. There was room for growth, but earnings estimates at that time required record sales growth. Back then, I explained in my March Earnings Insight article how post-2009 sales were tepid, and why 4.5% growth was more realistic. A year later, reported sales growth is 4.4%. Missed it by that much.
The outlook for full year 2017 operating earnings is, brace yourself, 22%! Estimates have been declining in dollar terms, but not as sharply as 2016 earnings. Hence 2017 estimates appear to be rising in figure-1 relative to 2016. Has something changed fundamentally, or is this more over-optimism?
Likelihood of Achieving 2017 Earnings Estimates
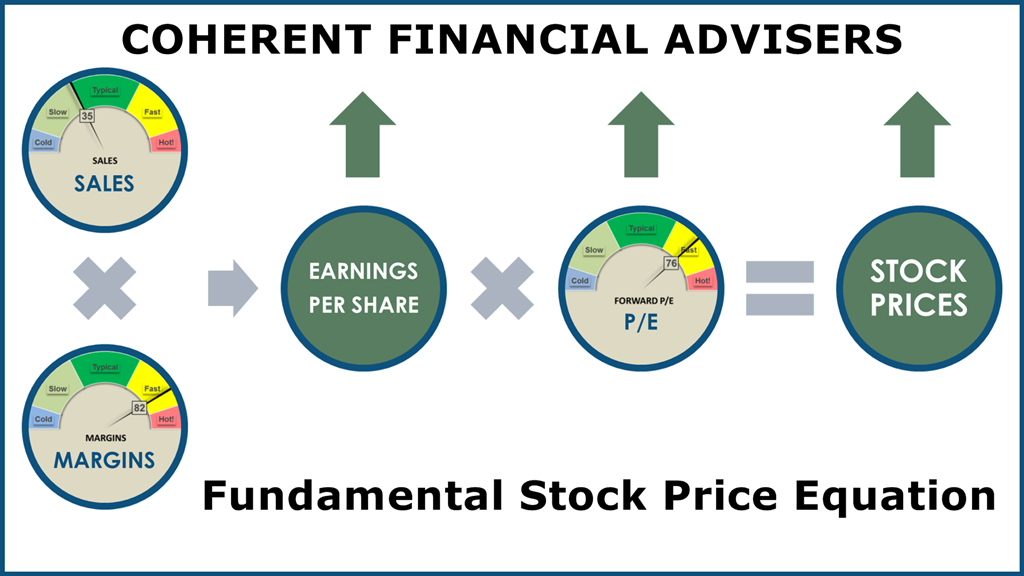
The likelihood that 2017 earnings will grow 22% over 2016 is optimistic despite the temporary silver lining effect. Returning to our financial periodic table of elements, figure-3 illustrates the relationship between sales, margins, and P/E. Our fundamental stock price equation works as follows.
“The likelihood that 2017 earnings will grow 22% over 2016 is optimistic.”

An increase in sales or margins is reflected proportionately in earnings. Margin3 is a way of measuring the portion of sales left over after paying expenses. To say that margins have increased means that expenses have decreased in proportion to sales.
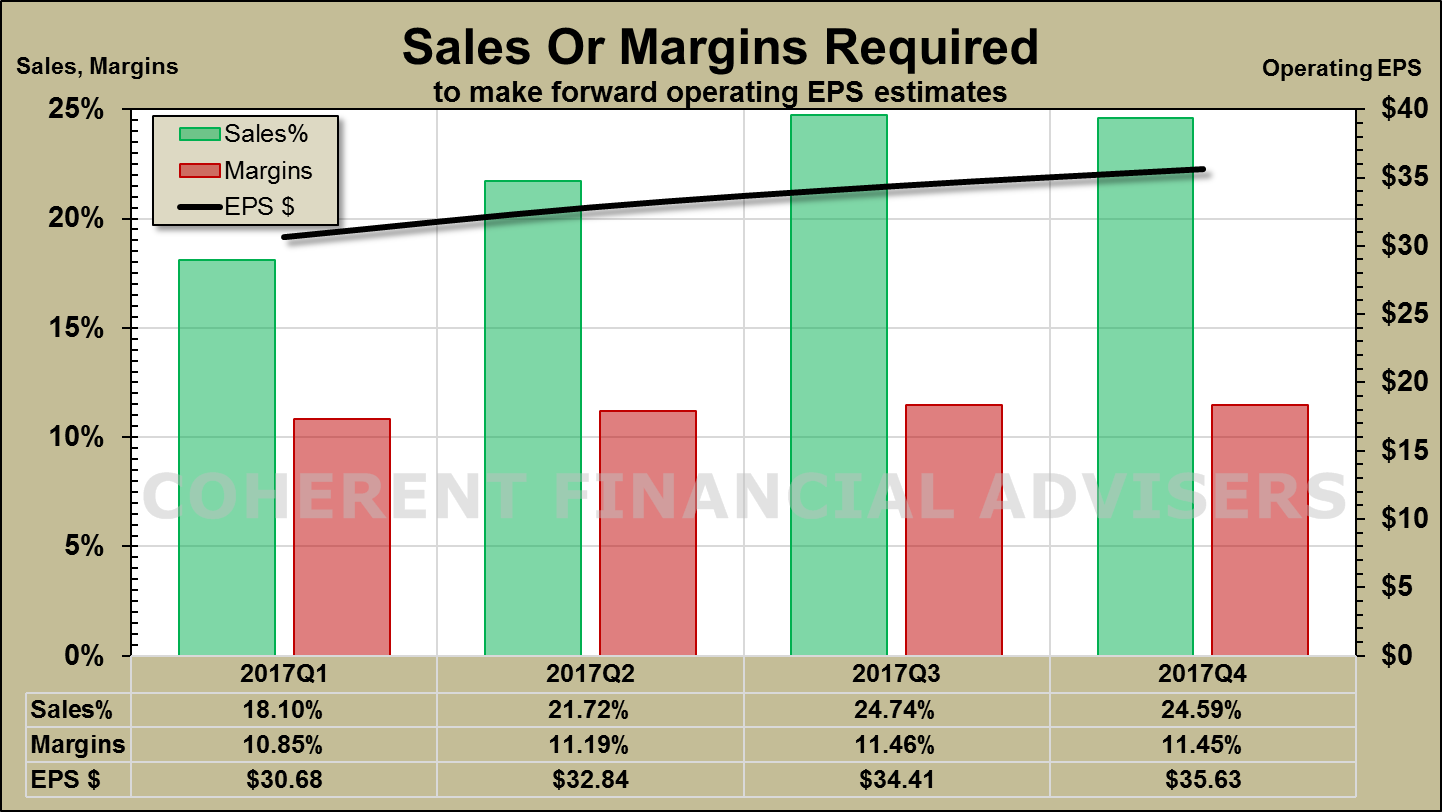
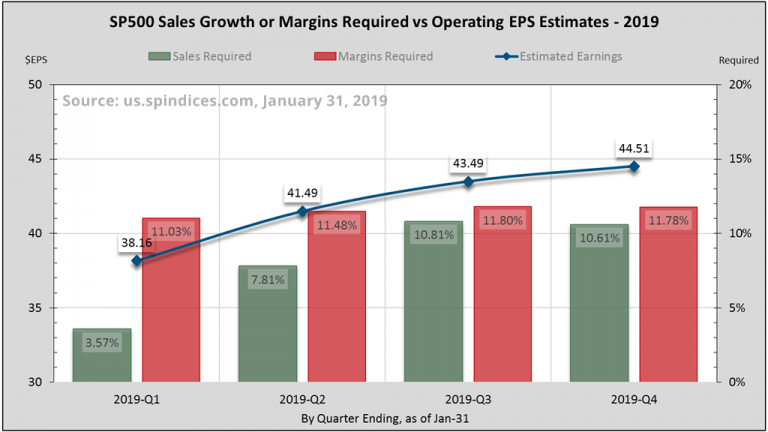
The black line in figure-4 shows estimated 2017 quarterly earnings in dollars per share totaling $131, a 22% increase from last year’s $107. The bars show sales (green) or margins (red) required to make target earnings, while holding the other at its 4-year median rate.
If operating margins track their 4-year median rate of 9.5%, sales must grow on average 22% for four consecutive quarters. The highest four quarters we have seen since 2000 averaged 13%, and they were not consecutive.
Conversely, given a median 3.15% sales growth, margins must maintain an average exceeding 11% per quarter. The highest rolling 4-quarter operating margins we’ve seen since 2000 was 9.9%. Figure-2 indicates that revenue has more room to grow than margin.
What This Means To The Stock Market Trend
Sales growth is finally picking up, but margins, P/E, and cyclic factors remain headwinds. The March 2009 secular uptrend is getting a bit long in the tooth. Stronger earnings growth is likely this year but current estimates may be optimistic vis-à-vis sales and margins. Meanwhile, investors are paying decade high prices in terms of P/E, indicating much of the expected optimism may already be priced in.
“Why would investors pay more for the same dollar of earnings?”
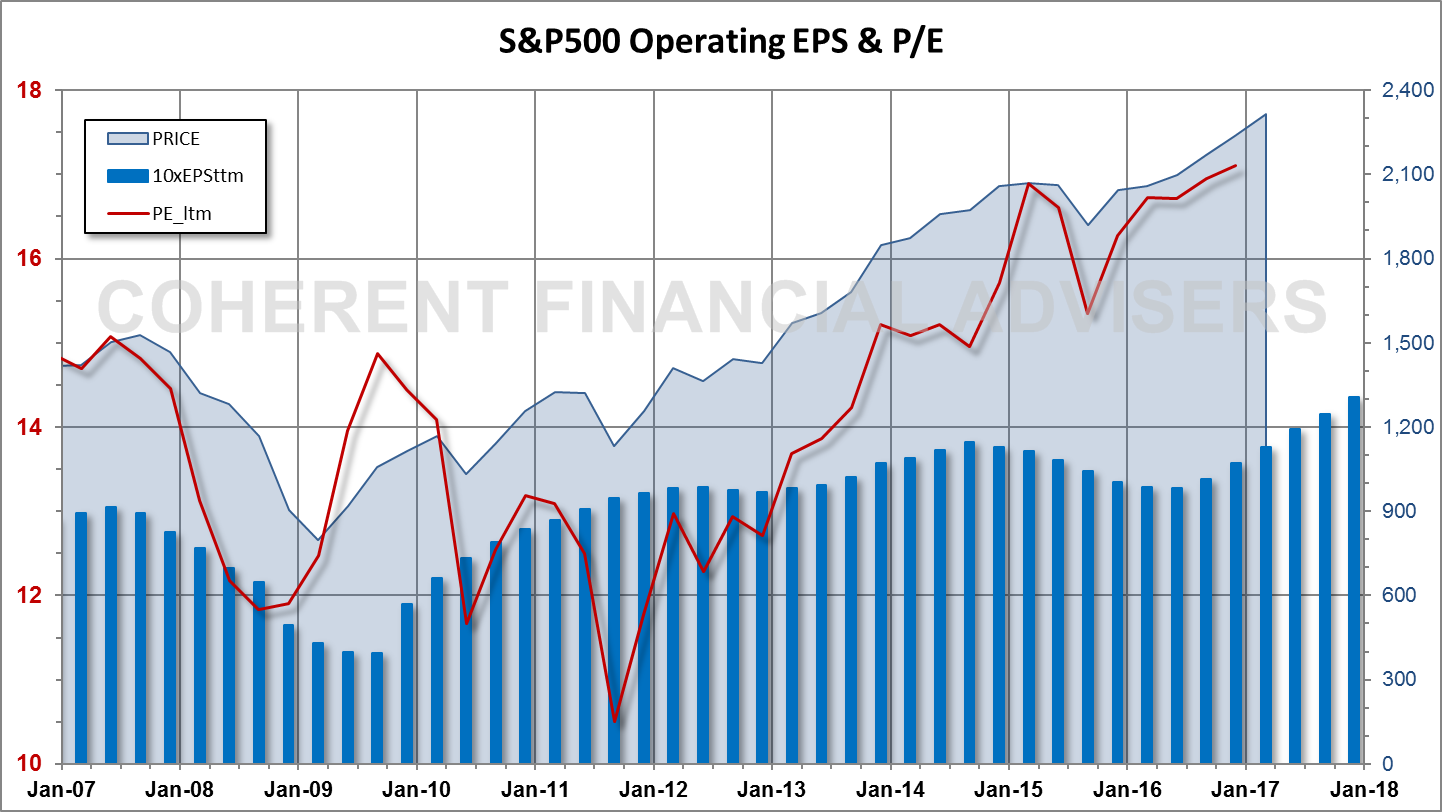
Relating stock prices as a multiple of earnings is analogous to measuring home prices in dollars per square-foot. The forward price-earnings multiple or P/E ratio is the price investors are willing to pay today for each dollar of expected future earnings. Stock prices can increase simply by investors paying more for each dollar of earnings, as figure-3 illustrates. However, figure-2 indicates P/E is already running it the upper quartile of its historic range.
Figure-5 shows P/E has risen more than 60% since late-2011, to its highest level of the 2009 secular bull market, higher even than 2007. Why would investors pay more for the same dollar of earnings? It depends on both earnings quality and expected growth rate relative to other choices offered in the marketplace. For instance, earnings yield is nearly twice that of the 10-year Treasury.
If earnings were in the hands of Tom Brady and the New England Patriots, one might not bet against 22% growth. Markets don’t react well when priced-in expectations disappoint. At Coherent, we’ve benefited from having positioned portfolios bullishly before elections. Now, we can afford to become more defensive in the longer-term expectation of a correction.
Warm regards,
Sargon Zia, CFA
February 17, 2017
You are welcome to comment!
Recommended Reading:
Manager’s Letter 2016 Q4
Coherent Investor December 2016
Earnings Insight November 2016
Published quarterly, Earnings Insight provides analysis and summary of material trends in aggregate U.S. company earnings as interpreted by the author and Chief Investment Officer of Coherent Financial Advisers.
Footnotes:
- Data source: S&P Dow Jones Indices, us.spindices.com as of February 16, 2017, with more than 80% of S&P 500 companies having reported fourth quarter earnings. Therefore, full year 2016 reported earnings are a blend of 95% actual, and 5% estimated figures. Values are rounded for ease of reading. Analysis and interpretation provided by Coherent Financial Advisers.
- We want to pay attention to real and recurring drivers of company growth, looking past the non-cash and accounting related practices. Therefore, we have chosen to analyze operating data where possible, rather than as-reported figures usually cited.
- Margin: Expenses are typically measured in terms of earnings left over from, and in proportion to revenue. Given $100 sales and $92 expenses per shares, margin becomes 8% or $8 per $100 of sales. Increasing margins means decreasing expenses in proportion to sales.