Coherent Investor: Indices, Benchmarks, & Performance
Have you watched The Dow thinking why your stock portfolio is acting differently? Have you wondered what to expect in good markets or bad? Learning simple facts about indices, benchmarks, and performance strategies will shed light on many questions.
Quick Before It Sinks!

In the TV series, Gilligan’s Island, Gilligan sets his traps deeper into the lagoon to catch larger lobsters. He secures the traps unwittingly using the Professor’s tide measuring stick, leading him to believe the island is sinking. “That old stick” was the Professor’s benchmark.
Indices are constructed to convey trends about specific market segments. Combining indices into a custom benchmark provides a reference for designing portfolios and measuring performance. Applying the right benchmark to a relative return strategy helps understand what to expect from your investments. In this articles we discuss:
- Two important characteristics of indices
- Two key purposes of benchmarks
- Two basic performance strategies
Two Important Characteristics of Indices
Understanding composition and weighting methodology explains performance variation between indices, and their relation to your portfolio. Consider three popular stock market indices, the Dow Jones Industrial Average™ (“The Dow”), the S&P 500®, and the Russell 3000® in terms of their:
- composition: individual stock universe and selection process
- weighting: how much of each security is held proportionately
Composition: The Russell 3000 index consists of the largest about 3,000 US-traded companies incorporated in the US. Similarly, the S&P 500 consists of the largest 500. The venerable Dow Jones Industrial Average, perhaps the most often quoted proxy for “the market”, shoehorns 30 stocks selected from the S&P 500, excluding utilities and transports.
“If you’ve been watching The Dow and wondering why your diversified stock portfolio is acting differently, now you know.”
The Russell covers about 98% of the US equity market to the S&P’s 80%. The Dow covers about 23%, as shown in figure-1. Selection methodology also differs considerably between these indices. The Russell employs a comprehensive and highly objective process. The Dow represents “large and well-known U.S. companies”.

Weighting: To construct a market-capitalization1 weighted portfolio, you would buy stocks in dollar amounts proportional to their market value. For instance, buy twice the total dollar position in $2.4B Microsoft than $1.2B Bank of America. Market-capitalization is the most common weighting used by indices today, including the Russell and S&P. It’s self-rebalancing, and reflects how the overall market actually behaves.
But The Dow is uniquely price-weighted, like buying an equal number of shares of each stock. A 1% move in a $250 stock would have ten times the effect on the index as a 1% move in a $25 stock. This was an elegantly simple idea when The Dow was launched in 1869. So was riding a horse to work.
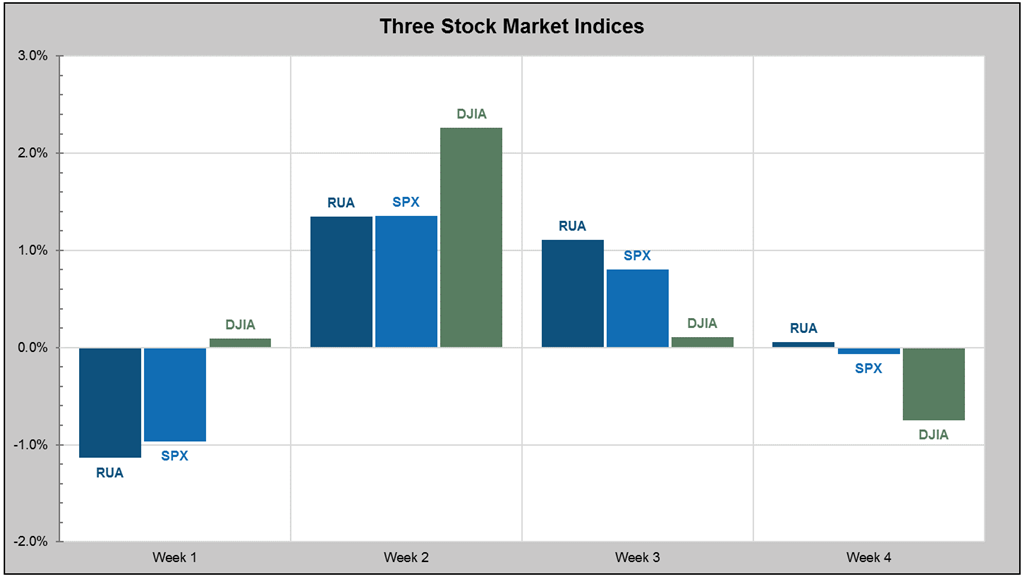
Figure-2 illustrates a sample of the performance variation between these three indices. If you’ve been watching The Dow and wondering why your diversified stock portfolio is acting differently, now you know.
Sources are included in the footnotes2. Click here for index fact sheets.
Two Key Purposes of Benchmarks

A benchmark can be one index, or a combination of indices. A custom benchmark combines indices weighted to simulate the risk and return characteristics an unbiased portfolio. Benchmarks serve as a reference for:
- designing portfolio holdings
- measuring relative performance
Designing portfolios: A portfolio manager selects securities (stocks, bonds, ETFs, or mutual funds) to design a portfolio replicating his assigned benchmark. He may adjust allocations to deviate from it based on his view of prevailing market conditions.
“A reference benchmark is the ‘truth stick’ in measuring the outcome of the portfolio manager’s investment decisions.”
For instance, figure-4 illustrates recent performance of three broad-market funds tracking US stocks, US bonds, and International stocks. The fourth fund, symbol-AOR, is a 60/40 blend of about 34% US stocks, 28% International stocks, 35% US bonds, and 3% cash.
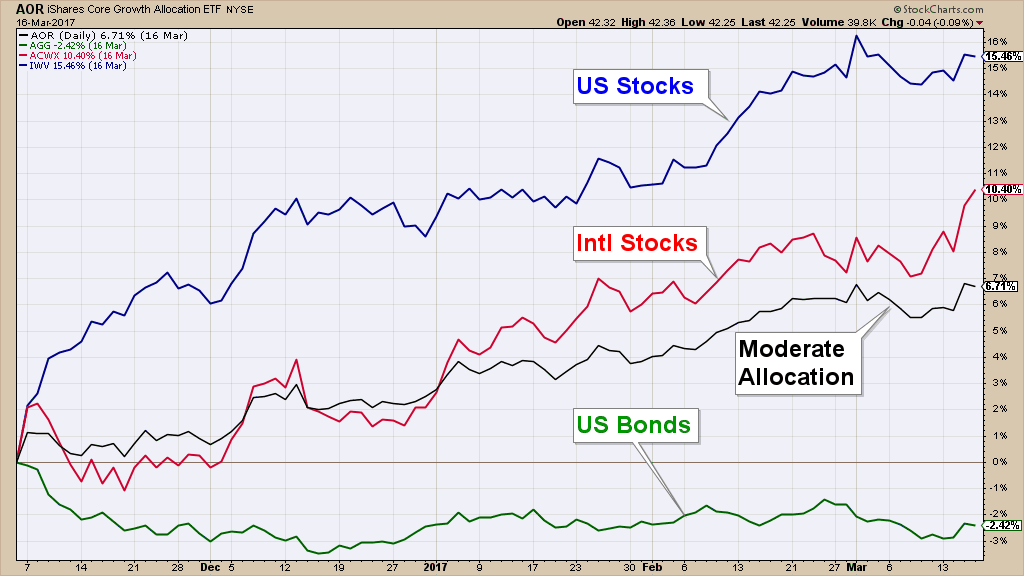
Measuring relative performance: AOR underperformed over the brief period shown by about 0.6%. This may be attributable to differences between fund and benchmark holdings. For instance, AOR holds a different mix of bonds at a higher effective duration. It is under-allocated to emerging market stocks, and has numerous deviations in its US stock portfolio.
A reference benchmark is the “truth stick” in measuring the outcome of the portfolio manager’s investment decisions. It should be held constant for as long as the portfolio’s objectives remain unchanged.
Indices and benchmarks are mathematically constructed, hypothetical indicators which cannot be directly owned. They transcend real world challenges such as fees, tax consequences, rebalancing costs and unexpected cash flows. But they are valuable for constructing portfolios and measuring their performance.
Two Basic Performance Strategies
Investors want to know, “How well did my portfolio perform?” But, compared to what? It helps to understand two basic performance strategies:
- absolute return
- relative return
Absolute Return: A portfolio managed to generate positive or some minimum target return follows an absolute return strategy. A detailed and robust risk management system is vital to avoid taking disproportionate risks in relation to the return objective.
“An index fund manager’s mandate is to track the benchmark like a Blue Angels wingman.”
Bond portfolios are a common application of absolute return. For instance, an individual investor needs to offset expenses, or a pension fund must match its long-term cash flow obligations. A hedge fund may manage its stock portfolio following an absolute return strategy.
Relative Return: A portfolio managed to generate returns relative to a benchmark follows a relative return strategy. A properly designed benchmark provides a constant reference for measuring portfolio performance against the benchmark’s return, volatility, draw-down, and virtually any other objective measure.
Relative Latitudes: How much can a portfolio manager deviate from the benchmark? Essentially no latitude is afforded a fully passive strategy. An index fund manager’s mandate is to track the benchmark like a Blue Angels wingman. An enhanced-passive strategy permits enough deviation to seek surplus returns to offset expenses. Active management allows more freedom in adjusting portfolios to changing market conditions and rising or abating risk levels.
Transparency, Accountability, Fair Treatment
At Coherent, we are committed to the transparency, accountability, and fair treatment our clients deserve. We employ comprehensive processes in establishing benchmarks, measuring and attributing performance, and promptly adjusting portfolios.
I hope this article has increased your understanding of and appreciation for indices, benchmarks, and performance strategies. If you have any questions, feel free to use the comments section, or to contact me directly.
Warm regards,
Sargon Zia, CFA
March 17, 2017
You are welcome to comment!
Recommended Reading:
What Moves The Market?
Understanding Dividends
Why Coherent
Published regularly, the Coherent Investor series focuses on the current conditions of the securities markets as interpreted by the author and Chief Investment Officer, unifying multiple investment disciplines including fundamental and technical analysis.
Footnotes:
- Market-capitalization = current security price X outstanding shares. Note that share price is largely an arbitrary figure. The S&P 500 was the first cap-weighted index.
- The Russell 3000 Index is maintained by Russell Investment Group, ftse.com. Data for S&P and Dow Jones indices is provided by S&P Dow Jones Indices LLC, a division of S&P Global, us.spindices.com.