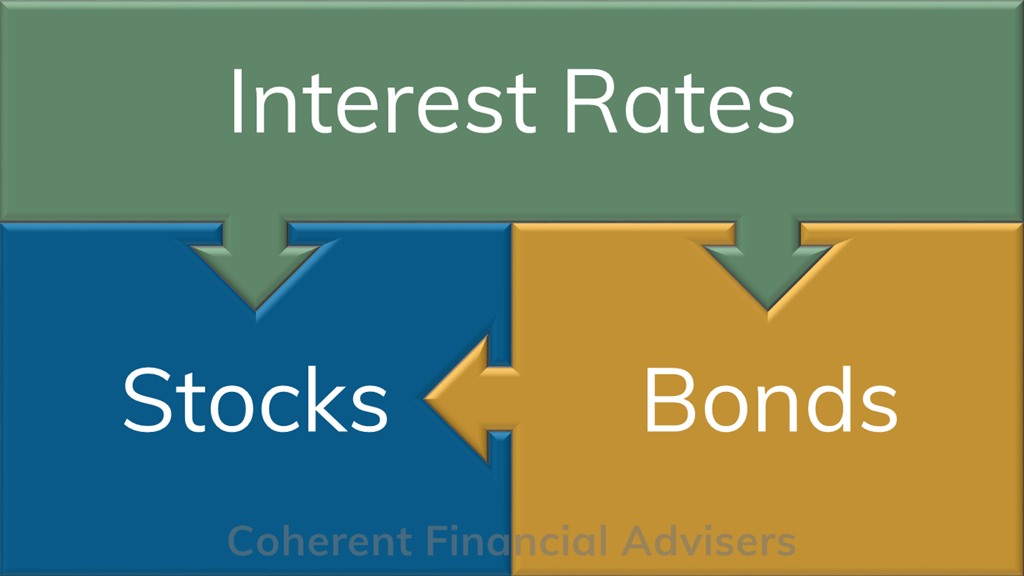
Stocks, Bonds & Interest Rates
Investors are often apprehensive about how changing interest rates will affect their investments. Record low bond yields look poised to break out of a 6-year range. Will rising rates squash stocks? Burst bonds?
In just 35-years, we’ve witnessed the highest and lowest interest rates ever recorded since The First Bank of the United States was founded in 1791.
In this article, we will take in a bird’s eye view of US interest rates past and present. Then, we’ll examine how changing interest rates affect stocks and bonds in theory and in practice. Our purpose is to gain a better perspective and understanding.
- Interest Rates in Perspective
- How Interest Rates Affect Stock Prices
- How Interest Rates Affect Bond Prices
Note: Our proxy for interest rates is the US 10-year Treasury, constant maturity, average monthly yield.
Interest Rates in Perspective
In recent weeks, we have seen several 2% intra-day swings in the stock market. Comparatively, interest rates seem to crawl at a snail’s pace, sometimes taking years to move 2%. A look at the bigger picture may provide some perspective of today’s record-setting low rates.
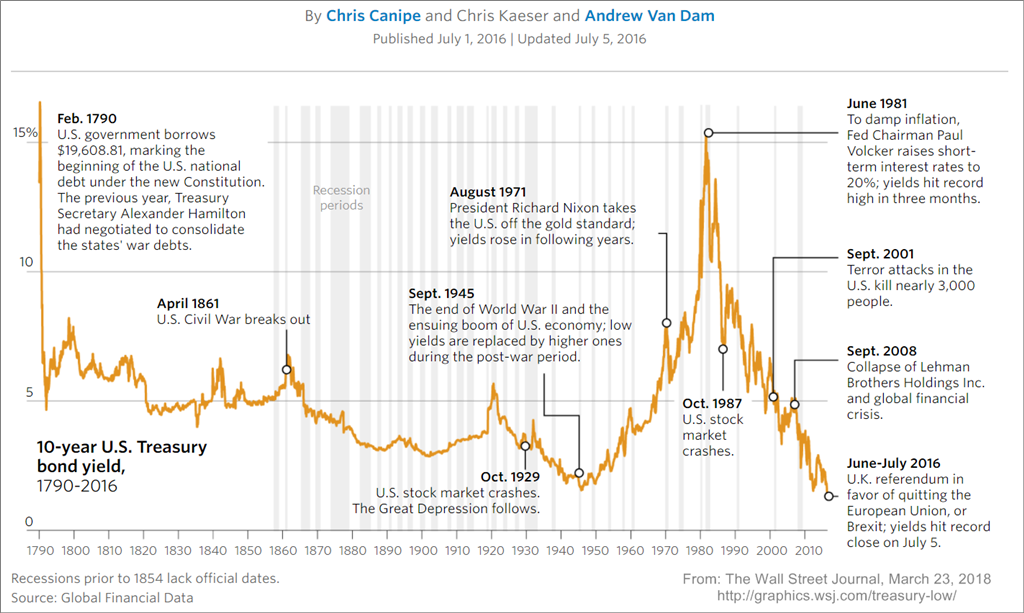
After declining to historically low rates in the 1940’s, the 10-year Treasury yield1 rose to a record high of over 15% in September 1981. Rates declined again for three decades to a new record low of 1.53% set in July 2012. Four years later, this low was retested in July 2016 at 1.50%.
In just 35-years, we’ve witnessed the highest and lowest interest rates ever recorded since The First Bank of the United States was founded in 1791. Rates have remained below 3% now for more than six years.
The fear du jour is that rising rates will disrupt the bull market in stocks. Perhaps, but a far more insidious foe lurks.
A More Recent Perspective
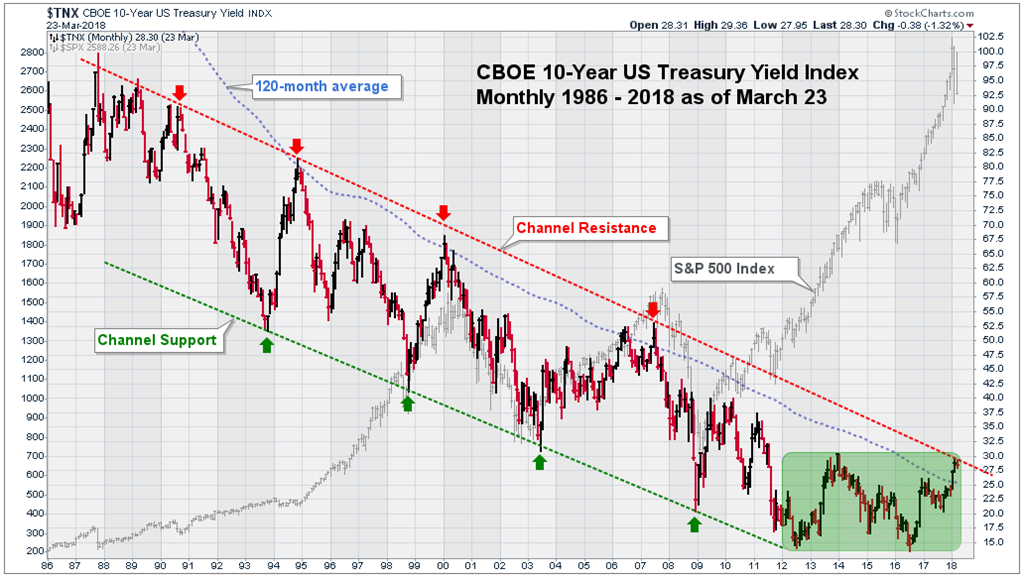
Figure-2 shows the 10-year Treasury yield from 1986 through March 23, 2018. Note how rates cycled from peak to trough (arrows) within a declining channel (dashed lines). But since the July 2012 lows, rates have been range-bound between 1.5% and 3% (green box). Rates are presently near the top of this range.
Prior to each turn in rates, how often did investors fear gremlins which didn’t materialize? The fear du jour is that rising rates will disrupt the bull market in stocks. Perhaps, but a far more insidious foe lurks – record operating margins!
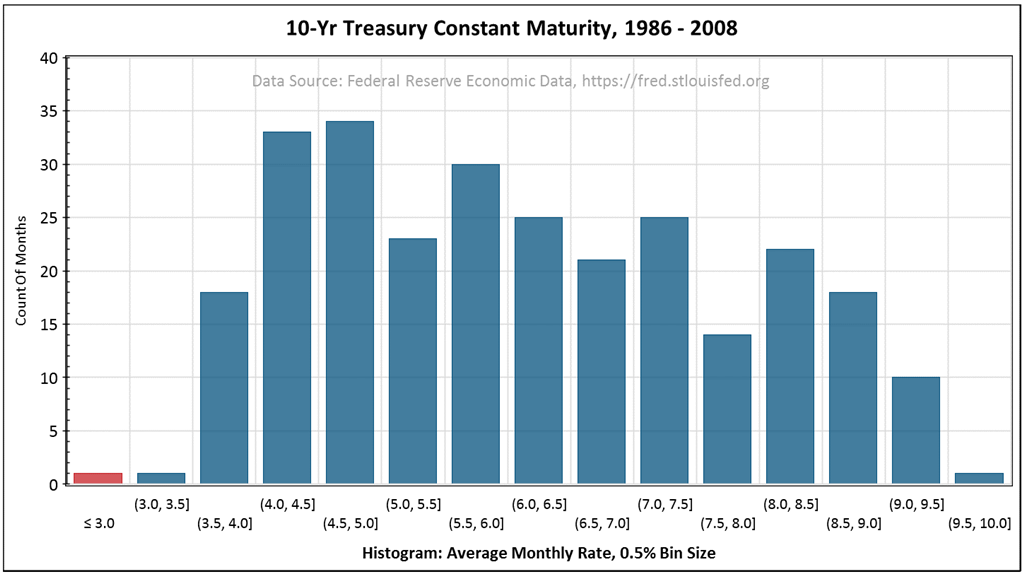
Figure-3 is a histogram of the 10-year Treasury rate from 1986 through 2008. The bars count months that the yields averaged within each 0.5% range. Since mid-2011, rates have literally fallen “off the chart”.
How Interest Rates Affect Stock Prices
Investors consider many factors, including the market’s current valuation, expectations for earnings growth, and dividend and earnings yield in relation to bonds. Rising interest rates put pressure on stock prices by making their yield and valuation less favorable.
“Beware of geeks bearing formulas.” – Warren Buffett
In Theory
Valuation models mathematically compute a security’s theoretical fair value relative to a risk-free investment. For example, the venerable Dividend Discount Model (figure-4) discounts a stock’s future dividends by the investor’s required rate of return. Required return is typically the risk-free US Treasury rate plus a risk premium.
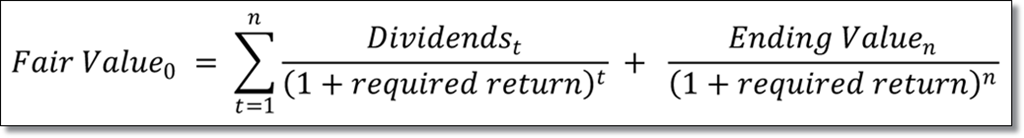
The key here is that the discount rate is in the denominator. As rates rise, the fair value declines. Stocks become less favorable, or even over-valued, contributing to a correction.
With interest rates stuck near record lows for so long, demand for stocks continued even at above-average valuations. That’s been one effect of the Fed’s historically accommodative policy, intended or not.
In Practice
What really happens when interest rates rise? The answer depends in part on the stock market’s valuation and prospects for earnings growth. At the January 26, 2018 stock market peak, valuation was at its highest level since the 2009 recession lows, and well above the long-term average2. Meanwhile, 2018 earnings growth estimates may prove to be too optimistic due in part to the margins hurdle.
“In theory there is no difference between theory and practice. In practice there is.” – Yogi Berra
Investors also consider the dividend and earnings yield of stocks relative to bonds. At the January highs, the S&P 500 Index’s dividend and earnings yield were 1.78% and 4.36%, respectively3, while the 10-year bond yielded 2.62%. Even the 5-year and 3-month yields were 2.4% and 1.39%.
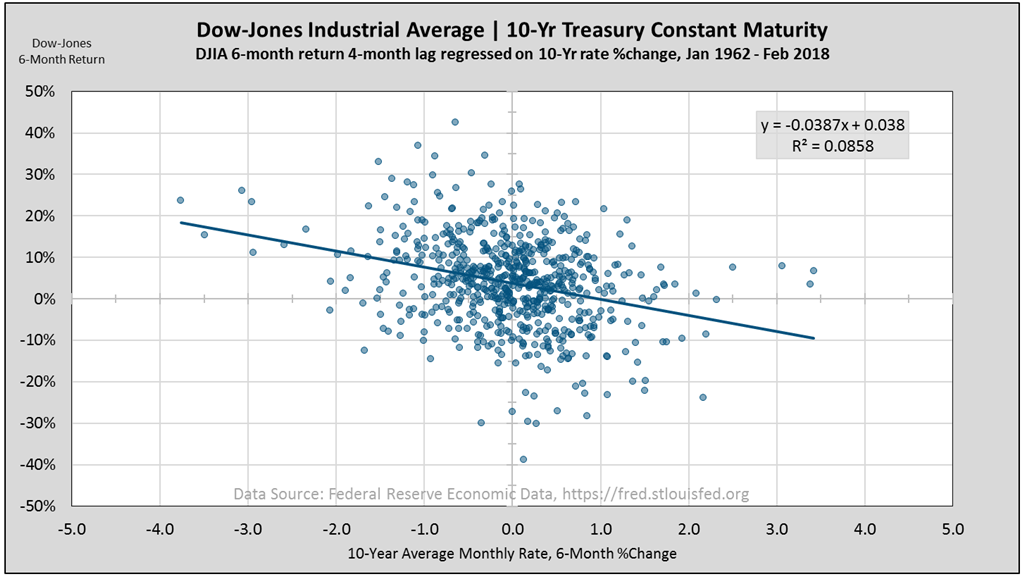
In practice, stock markets rarely react with mathematical precision to (or in time with) changing bond yields. Figure-5 compares returns of the Dow-Jones Industrial Average4 to changes in the 10-year Treasury yield. There is a relationship, perhaps as clear as divining spilled coffee grinds with magic eye glasses. The effect of declining rates appears to be more defined than when rates rise.
How Interest Rates Affect Bond Prices
The general relationship is that bond prices move inversely to market interest rates. As interest rates rise, bond prices fall. But in what magnitude do bond prices respond to rates? This varies depending on a bond’s characteristics.
In Theory
The sensitivity of a bond’s present value to a change in interest rates depends in part on the amount and timing of its interest payments. The larger and earlier the payments, the lower its sensitivity. The time to maturity when a bond’s principle is repaid is another factor. The longer the time, the higher its sensitivity.
Measures of a bond portfolio’s sensitivity typically assume an instantaneous parallel shift in the yield curve. All rates across the entire term structure shift instantaneously by the same amount5. One common sensitivity measure is effective duration. It compares the percent-change in a portfolio’s value to a small change in rates. It is a unitless ratio (not “years”) and it is quoted without the negative sign.
Why hasn’t the US bond index declined 9%?
Consider the typical US aggregate bond market index consisting of several sectors, mainly government, securitized, and corporate across a diverse spectrum of maturities. At this time, its effective duration is approximately 6. We should observe a 1.5% price decline for an instantaneous 0.25% rate increase across the yield curve.
In Practice
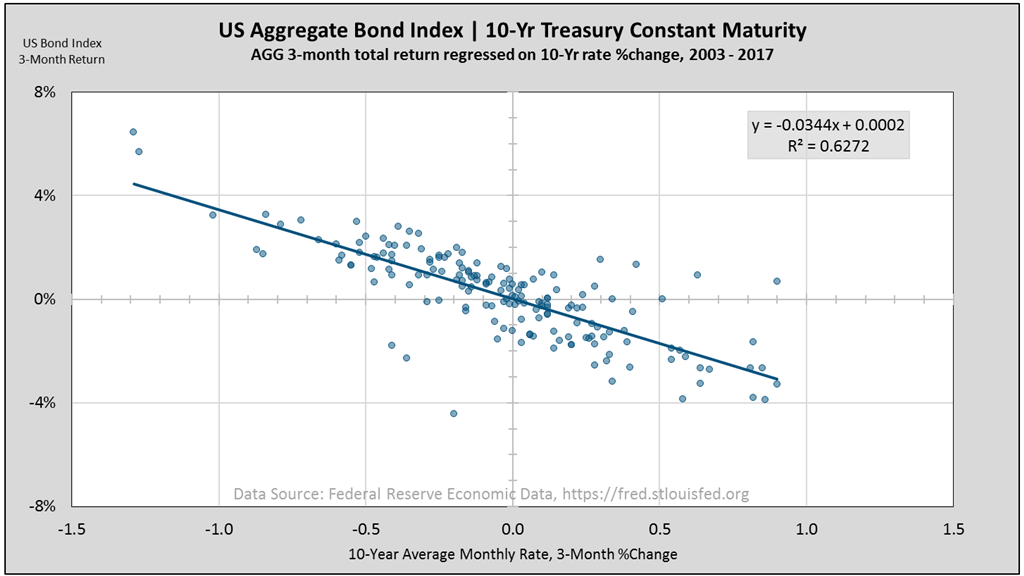
In practice, the relationship between interest rates and bond prices is more defined than for stock prices6. Just compare figures 5 and 6. However, rates seldom move instantaneously in large amounts or in parallel across all bond sectors and maturities. This is why the yield curve can twist, steepen, flatten, or occasionally even invert.
Between 1986 and 2008, it took an average 67-months for the 10-year Treasury rate to complete each cycle (figure-2). The most recent 1.5% rise has taken almost two years from July 2016 through March 23, 2018. In that time, the US aggregate bond index declined about 1.4%.
Why hasn’t the US bond index declined 9% commensurate with its effective duration (6 x 1.5)? The 1.5% rate increase I cited was for only one bond type, at one maturity, and over 21-months. Meanwhile, our diversified bond portfolio reinvested interest and principal payments as the yield curve changed shape.
Closing Thoughts
Rising interest rates put pressure on stock and bond markets. But a changing interest rate environment is just one factor to consider. Trends in earnings growth, market valuations, sector relative performance, inflation, cyclicality, and a host of other factors collectively provide a broader context.
Portfolio decisions require understanding the broader practical context outside the sterile vacuum of theory. In theory, we must by necessity accept certain assumptions. In practice, we don’t.
Warm regards,
Sargon Zia, CFA
March 30, 2018
You are welcome to comment!
Recommended Reading:
Earnings Insight February 2018
Tax Cuts and The Stock Market
…more Coherent Investor Series
Published regularly, the Coherent Investor series focuses on the current conditions of the securities markets as interpreted by the author and Chief Investment Officer, unifying multiple investment disciplines including fundamental and technical analysis.
How can we help you?

Do you need help with financial planning, investment management or benefits guidance? Contact us for a complimentary call. We look forward to discussing your unique financial goals and personal values!
Footnotes:
- Source: Federal Reserve Economic Data, https://fred.stlouisfed.org.
- According to Factset, “The forward 12-month P/E ratio for the S&P 500 is 18.4. This P/E ratio is above the 5-year average (15.9) and above the 10-year average (14.2)”. See www.factset.com/insights, January 19, 2018.
- On January 26, 2018 full quarter earnings had been reported for 2017-Q3. Dividend was $12.78 x 4 / 2872.87 = 1.779%. Operating earnings yield was $31.33 x 4 / 2872.87 = 4.362%. The 10-yr Treasury yield on January 25 was 2.621%.
- Figure-5: Dow-Jones Industrial Average Price holding period return, lagged 4-months and regressed on 10-year Treasury constant maturity average monthly rate %change, rolling 6-month period. Data from January 1962 through February 2018. Source: Federal Reserve Economic Data, https://fred.stlouisfed.org. The 4-month lag demonstrated higher correlation.
- A bond’s price sensitivity to changes in interest rates varies at different market rates. Duration is typically higher when rates are lower. Therefore, duration is measured for a small change in rates. A 1% change is not small.
- Figure-6: The iShares Barclays Aggregate Bond ETF (NYSE/ARCA: AGG) monthly total return regressed on 10-year Treasury constant maturity average monthly rate %change, rolling 6-month period from 2003 through 2018. Source: Federal Reserve Economic Data, https://fred.stlouisfed.org. No lag demonstrated higher correlation.