Tax Cuts and The Stock Market
Congress passed a new tax plan this week. Much anticipation and debate surround the effect of these tax cuts on the GDP, and by implication on the stock market. What realistic expectations can we have in the near term?
“My colleagues and I are in line with the general expectation among most economists that the (tax cuts) would tend to provide some modest lift to GDP growth in the coming years.” – Janet Yellen, Fed Chair, December 13, 2017
How changes in the tax code affect GDP is a topic where angels fear to tread. Naturally, there is no shortage of opinion and analysis among mere mortals. Yielding the academic notion that tax cuts boost GDP, we instead examine a more direct connection, one between GDP and stock market prices. In this article we discuss:
- Company Revenues And The GDP
- Factors Affecting Stock Prices
- The Major Challenge in 2018
- Closing Thoughts
Note: Earnings data is as of December 21, with S&P 500 Index level near 2700. All earnings, margins and PE are operating figures.
Company Revenues And The GDP
Real GDP averaged 2.1% throughout 2010-2016. This is indicative of “an economy that has had disturbingly low productivity growth,” as Fed Chair Yellen noted1. In the second and third quarters of this year, annualized GDP has risen above 3%. The FED expects 2.5% real growth for 2018. Others expect 3-5% for the longer term. But how has GDP related to stock prices?
“The history of taxation shows that taxes which are inherently excessive are not paid.” – Andrew Mellon, US Treasury Secretary, 1924
We begin by examining how GDP relates to corporate sales, as proxied by the S&P 500 Index. While economic output measures like the GNP may be better indicators of corporate sales, we will stick with the topic of recent public conversation, the GDP. However, we prefer nominal GDP to real GDP for comparison with S&P 500 Index sales data which includes inflation2.
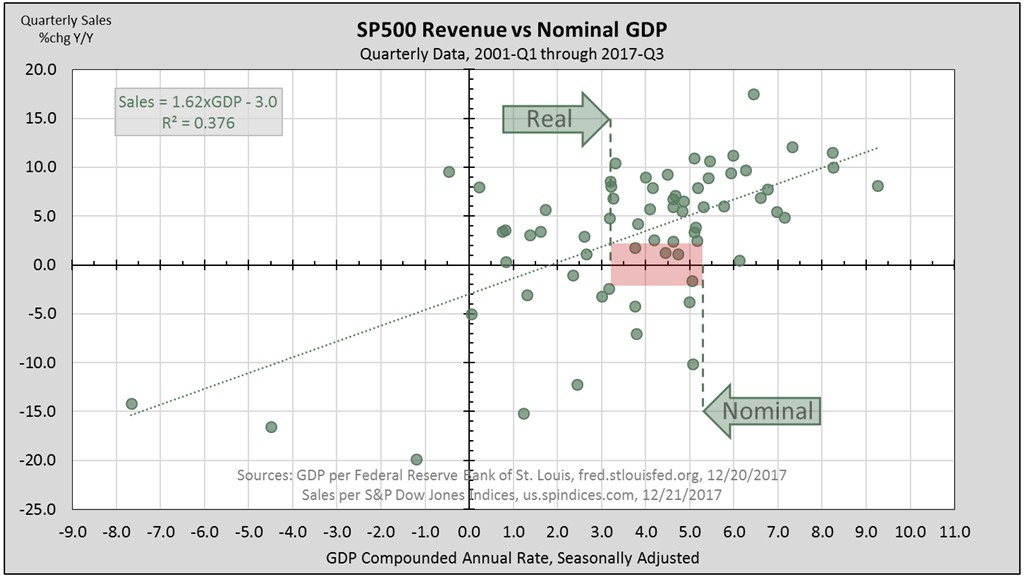
Figure-1 compares S&P 500 Index sales growth to nominal GDP. There is a positive relationship as expected, albeit not a very strong one. In quarters when nominal GDP has ranged between 3-5%, sales grew anywhere between +10% and -10%.
This third quarter’s 3.2% real GDP translates to 5.3% nominal after adding back the 2.1% price deflator, or inflation. In the same period, sales grew 6%. Expectations that tax cuts will produce 3-4% real GDP implies about 5-6% nominal, or higher if inflation rises. In this range, our best-fit line in figure-1 indicates sales would grow at around 8%.
If S&P sales grew 8% next year, can the stock market’s uptrend continue undamaged?
Factors Affecting Stock Prices
The stock market also responds to earnings. Sales and margins together produce earnings. What investors are willing to pay for these earnings (P/E) is another major factor. Figure-2 demonstrates the relationship between sales, margins, and P/E.
“It is a paradoxical truth that tax rates are too high today and tax revenues are too low and the soundest way to raise the revenues in the long run is to cut the rates now.” – President John F. Kennedy, December 14, 1962
A common way in which investors define the stock market’s price is as a multiple of its earnings level. This price-earnings multiple or P/E ratio describes what investors are willing to pay for each dollar of earnings. But where do earnings come from?
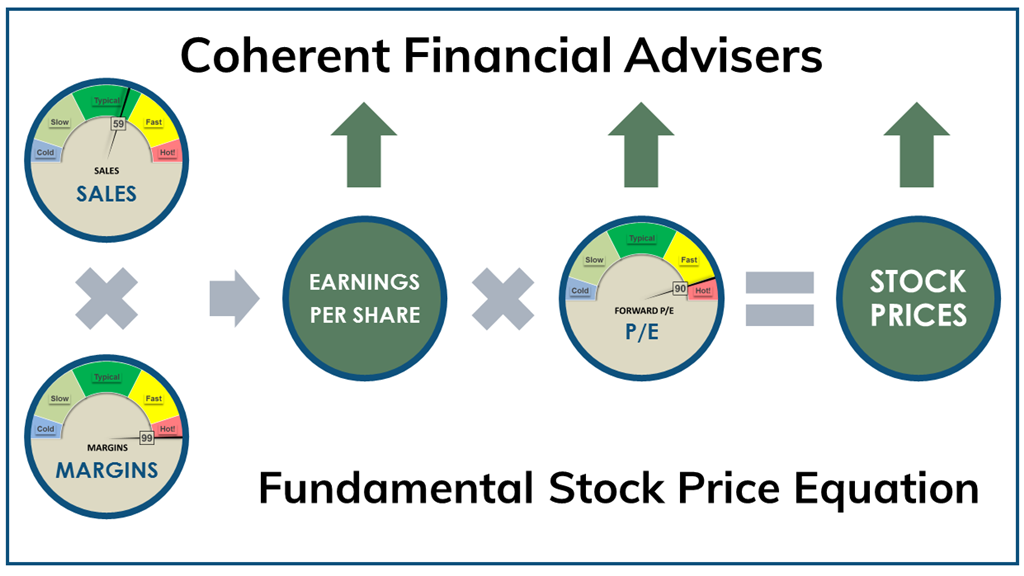
Earnings are what’s left over from sales after paying expenses. Another way of expressing this relationship is as a ratio of earnings to sales called margin. For instance, $100 sales and $10 earnings yields 10% margin.
Sales and margins define the earnings level and its growth rate. If sales grow 8% and margins 3%, their sum yields about 11% earnings3. At a constant P/E, the stock market’s price level would also rise 11%.
While the earnings level directly affects stock market prices, the earnings growth rate also affects the P/E multiple, compounding the impact upon stock market prices4.
Therefore, sales and margins produce earnings which directly affects stock market prices. The effect is further compounded by the earnings growth rate’s impact on the P/E multiple.
This relationship between sales, margins, and P/E works for both up-trends and down-trends.
The Major Challenge In 2018
The S&P 500 Index is up nearly 20% year to date, having experienced little more than minor 2-3% pullbacks along the way. Yet the stock market faces several challenges in 2018. The main challenge lies in achieving margins growth5.
“There are, after all, two rates that yield the same amount of revenue: high tax rates on low production, or low rates on high production.” – U.S. Representative Jack Kemp, a chief architect of the Reagan tax cuts
As time-series go, margin is highly cyclical. Margin levels tend to cycle between a floor and a highly resistant ceiling. It’s like breathing. How much can you inhale in one cycle before exhaling?
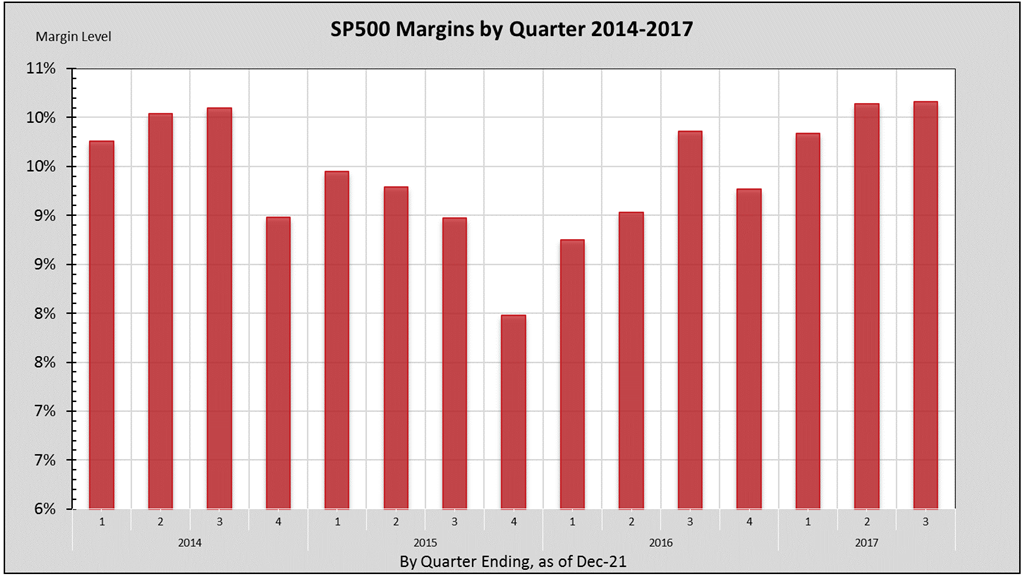
Figure-3 shows the margins cycle in recent quarters. After having risen to 10.1% in 2014, falling operating margins in 2015 put pressure on earnings growth. In turn, comparatively lower 2015 margins (as low as 8%) helped achieve positive earnings growth by mid-2016. I have called this the “silver lining effect“.
Margins have continued to rise since 2016 to a millennium record of almost 10.2%, presenting a challenging hurdle to future growth. The cycle of comparative earnings growth has turned from a tailwind to a stiff headwind.
Achieving further earnings growth through margins requires setting new millennium records. This is the major challenge for 2018.
Another challenge is the forward P/E ratio. What investors are willing to pay for expected earnings over the next four quarters is also at record levels. The current forward P/E ratio is the highest in 55-quarters, since 2003-Q4.
At current levels, a point-change in the P/E ratio translates to a 5% change in stock market prices. Always the wild card, the P/E ratio is as much a function of investor optimism as one of anticipated earnings growth.
Closing Thoughts
The stock market faces strong headwinds to growth in 2018 from record margin levels at relatively high valuations. Sales have room to grow depending in part on GDP, though that relationship is not entirely strong. While figure-2 depicts sales “in the green”, margins and forward P/E are “in the red” relative to their historic levels.
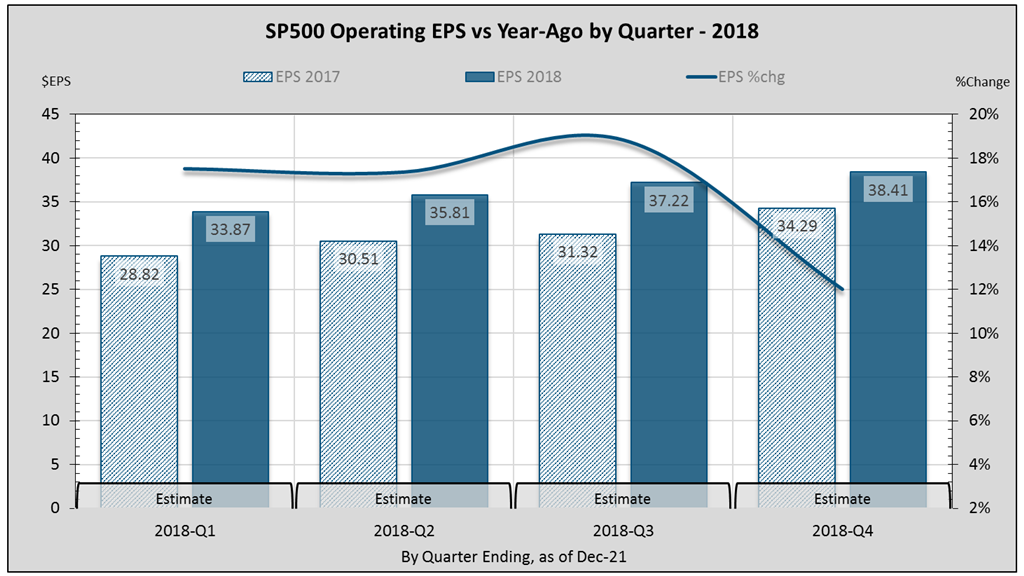
Full-year 2017 operating earnings growth was estimated earlier this year at over 22%. Reality has dwindled it to below 18%, still impressive. But analysts’ expectations for full-year 2018 earnings growth have never been much above 16%. I expect estimates to decline over time.
The conclusion of the matter is this. Prospects for the market’s uptrend rest almost entirely upon sales which are unlikely to produce 16% growth. The rest depends on investor optimism.
Wishing you Happy Holidays,
Sargon Zia, CFA
December 22, 2017
You are welcome to comment!
Recommended Reading:
Earnings Insight November 2017
Earnings Insight August 2017
Coherent Investor: 2017 Possibilities
Published regularly, the Coherent Investor series focuses on the current conditions of the securities markets as interpreted by the author and Chief Investment Officer, unifying multiple investment disciplines including fundamental and technical analysis.
How can we help you?

Do you need help with financial planning, investment management or benefits guidance? Contact us for a complimentary call. We look forward to discussing your unique financial goals and personal values!
Footnotes:
- Federal Reserve Chair Janet L. Yellen, press conference on December 13, 2017. Transcript available at federalreserve.gov/mediacenter/files/FOMCpresconf20171213.pdf.
- GDP is an economic measure of the market value of total domestic output within a country. GNP includes what residents earns from investments outside the country. About 30% of S&P 500 revenues are from international sales. While “real” GDP adjusts out inflation, “nominal” GDP uses current market prices reflected in SP500 corporate revenue.
- More accurately, earnings growth is the product of the two growth factors, sales and margins. For instance, 1.08 sales times 1.03 margin yields 11.2% earnings growth. Or, (1.08) x (1.03) – 1 = 0.112.
- The impact of sales and margins on earnings is explained in the Earnings Insight February 2017 and Earnings Insight August 2017 articles.
- Rate of growth is represented as a percentage of change measured from the current level relative to that in the same period the year before.