Earnings Insight November 2017
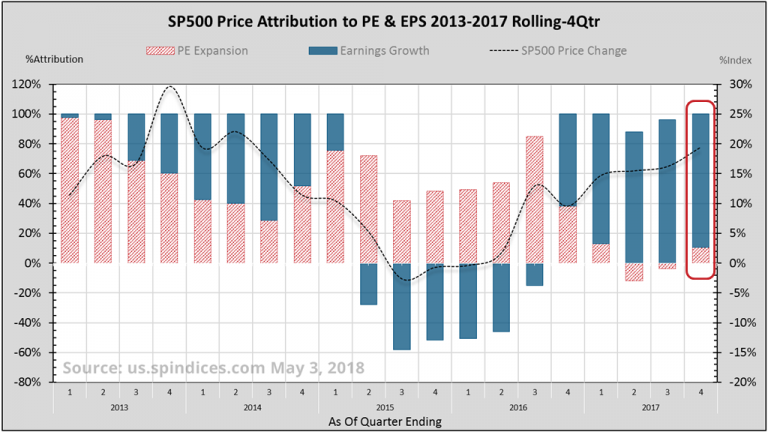
With third quarter reporting nearly concluded, S&P 500 companies are delivering growth rivaling post-recession 2010. Not surprisingly, valuations are also breaking records. Meanwhile, record margins present more challenging hurdles to 2018 growth.
S&P 500 companies are delivering growth rivaling post-recession 2010.
This quarterly Earnings Insight series is dedicated to answering three questions: What are the market’s expectations for growth? Are expectations grounded in a reasonable and rational basis? And how much expectation is already priced into the market? Our analysis is based primarily on aggregate forward looking estimates1 of the S&P 500 Index revenue and operating2 earnings.
In this November issue, we answer our three questions while we discuss these topics:
- How 2017 Earnings Are Shaping Up
- Why Q4 Expectations May Disappoint
- Introducing 2018 Earnings Estimates
Note: Earnings data is as of November 2nd, with SP500 Index level near 2590. Earnings, margins and PE are operating figures.
How 2017 Earnings Are Shaping Up
With 81% of S&P 500 Index companies having reported third quarter earnings as of November 2, we are now 70% of the way through full year 2017. Analysts’ latest estimates call for $125.25 per share, or almost 18% growth over last year’s $106.26. That’s marvelous by itself, but especially so when 2016 was up just 5.8% and 2015 had contracted 11%.
But there are caveats. S&P 500 Index price has risen to record levels while forward earnings estimates have declined. This exacerbates valuation concerns.
The cycle of comparative earnings growth has turned from easy to difficult.

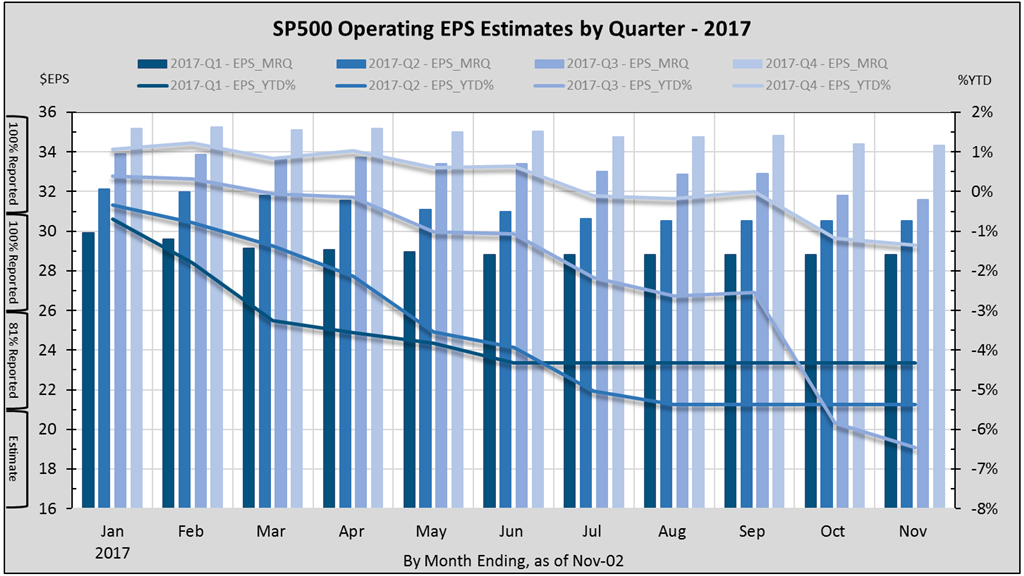
At the start of 2017, earnings were estimated at $131 for 23% growth. This estimate has dropped consistently every month (figure-1). Parsing estimates by quarter (figure-2) shows Q3 estimates alone are down 6.5%.
Why have 2017 earnings estimates dropped 4.3% year to date? And how does this bode for the fourth quarter? Earnings growth is a product of both sales and margins growth. For answers, we have to examine these components3 of earnings.
Reason #1: over-optimistic margins
Preceding each quarter’s reporting, Q1-3 margins have been over-estimated by 3.5% on average. In contrast, revenues have been under-estimated by about 1.2%.
A case in point, at the start of Q3, estimates called for margins at 10.85% and revenue at $303.56. With 20% of companies still to report, blended margin estimates have declined to 10.25% while revenue has risen to $308.
Reason #2: rising hurdles to growth
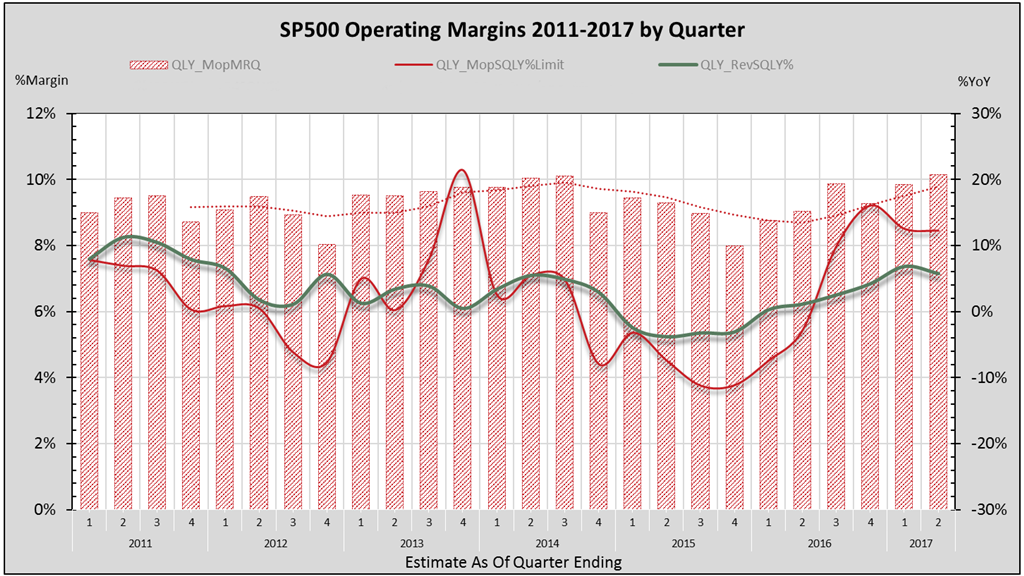
After seven consecutive quarters of contraction, the margins growth rate4 has been accelerating since 2016-Q3. Meanwhile, sales growth has been rising since 2016-Q1, after four consecutive quarters of contraction.
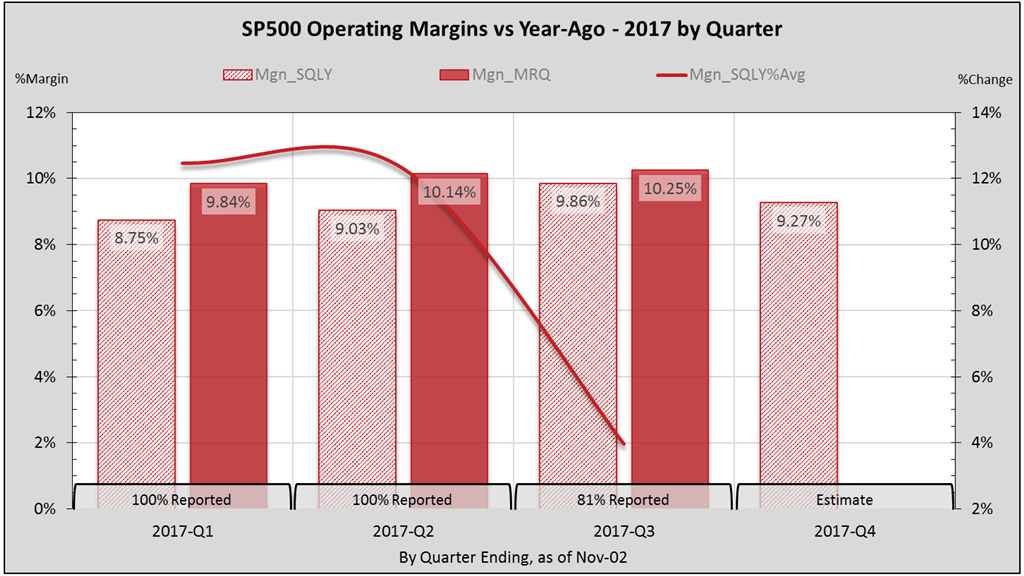
The cycle of comparative earnings growth has turned from easy to difficult as rising sales and margins levels present more challenging hurdles to future growth. This is especially true today as margins (figure-3) have risen to a new millennium record. And we are beginning to feel these effects.
As I warned in December’s Coherent Investor article, “Mid-2017 will be the apex for the silver-lining-tailwind effect of relatively easy comparable EPS growth.”
Why Q4 Expectations May Disappoint
Based on the preceding facts, it is likely that fourth quarter operating earnings estimates are optimistic, and will depress full year results. This again is due mainly to the margins hurdle.
Under these assumptions, Q4 earnings would fall below current estimates by 5.9%.
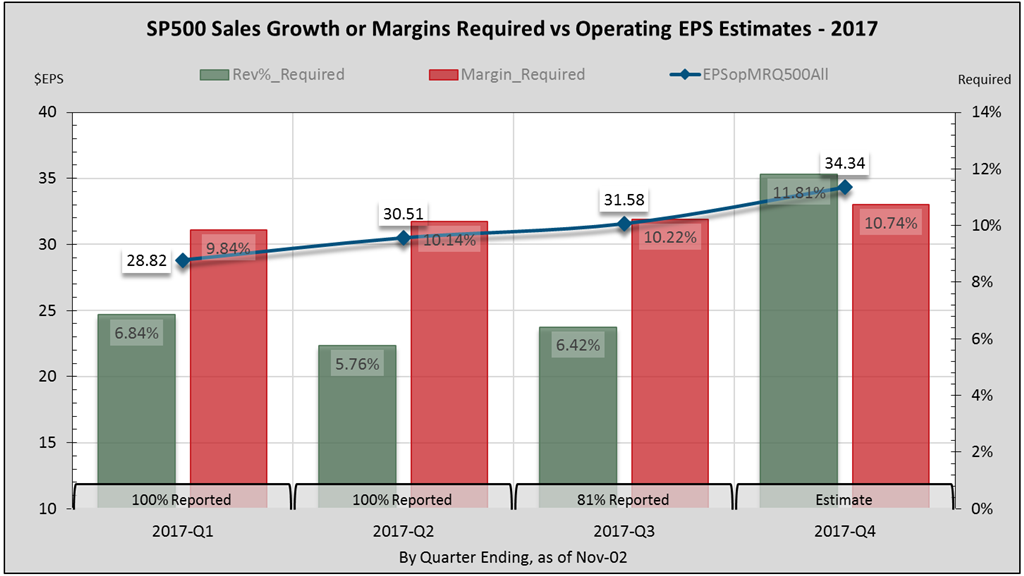
FactSet5 estimates Q4 revenue growth at 5.9%. But let’s accept the current three-quarters’ average of about 6.2%. To achieve current earnings estimate of $34.74, margins would have to clock in at 10.7% (figure-4). This is a bit optimistic.
There are three things you must know about operating margins.
- Margins exhibit serial correlation. Unlike a random coin toss, one quarter’s margin level is highly determined by the previous quarter’s outcome.
- Margins are cyclical. Rather than steadily trending in one direction, margin levels oscillate up and down with the business cycle6.
- Margins display seasonality. In the past 10-years, fourth quarter margins have dropped on average 6.7% from third quarter levels. The 15-year average decline is 4.3%.
What does this mean to full year 2017 estimates?
Current Q1-3 earnings total $90.91. Let’s say fourth quarter margins match Q3’s millennium record 10.2%. Using FactSet’s 5.9% revenue growth estimate puts Q4 earnings growth at about 16.5% over last year’s $27.90, or $32.56 (figure-5). If Q4 revenue growth matches Q1’s 6.84%, earnings would grow 17.5% to $32.80.
Under these assumptions, Q4 earnings would fall below current estimates by an average 5.9%. The full year’s target drops from $125.25 to between $123.47 and $123.71, and the forward price-earnings ratio climbs from 20.7 to 21.
Tidbit: It is interesting to note that Q2 earnings were the first in ten quarters to exceed 2014-Q3 levels.
Introducing 2018 Earnings Estimates
S&P 500 Index operating earnings for 2018 are estimated at over $144. This translates to 15% growth over current 2017 estimates. At first blush, this may also be optimistic.
Markets face strong headwinds to growth in 2018 at already high valuations.
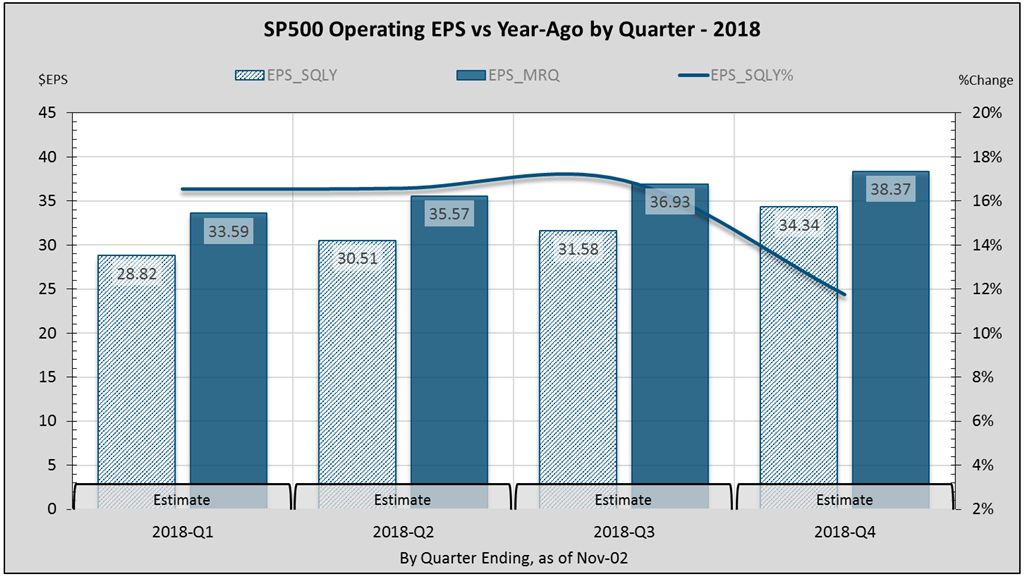
Earnings growth comes from margins or sales growth. And as 2017 margin levels rise, they become larger impediments to 2018 growth (figure-6). This is the looming challenge for 2018.
Even at record levels of 11%, margins would still only contribute about 4% to 2018’s 15% earnings growth estimate. The remaining 11% would have to come from sales. The last time we saw four consecutive quarters of sales growth averaging 11% was in 2006.
So, it could happen. Perhaps the anticipated changes to the tax code will fuel growth. Regardless, markets face strong headwinds to growth in 2018 at already high valuations.
Until our next Earnings Insight article in February, we at Coherent wish you a Happy Thanksgiving!
Warm regards,
Sargon Zia, CFA
November 8, 2017
You are welcome to comment!
Recommended Reading:
Earnings Insight Series
Coherent Investor Series
Articles About Investment
Published quarterly, Earnings Insight provides analysis and summary of material trends in aggregate U.S. company earnings as interpreted by the author and Chief Investment Officer of Coherent Financial Advisers.
How can we help you?

Do you need help with financial planning, investment management or benefits guidance? Contact us for a complimentary call. We look forward to discussing your unique financial goals and personal values!
Footnotes:
- Data source: S&P Dow Jones Indices, us.spindices.com as of November 2, 2017, with more than 81% of S&P 500 companies having reported third quarter earnings. Blended estimates combine actual reported figures with estimates for those companies not yet having reported. Full year 2017 estimated earnings are a blend of 70% actual, and 30% estimated figures. Values are rounded for ease of reading. Analysis and interpretation provided by Coherent Financial Advisers.
- We want to pay attention to real and recurring drivers of company growth, looking past the non-cash and accounting related practices. Therefore, we have chosen to analyze operating data where possible, rather than as-reported figures usually cited.
- The impact of sales and margins on earnings is explained in the Earnings Insight February 2017 and Earnings Insight August 2017 articles.
- Rate of growth is represented as a percentage of change measured from the current level relative to that in the same period the year before.
- Factset Research Systems, www.factset.com, Earnings Insight, October 10, 2017.
- Cyclicality and seasonality are two entirely different concepts. Cyclical analysis examines the periodic oscillations simultaneously present in the financial markets. It typically draws upon statistical analysis and mathematics prevalent in signal processing. Seasonality studies the effect of calendar seasons on market returns. This is discussed in our What Moves The Market article.