Earnings Insight February 2018
Earnings in 2017 have been spectacular. Estimates for 2018 have risen to a millennium record, and so have market valuations. But high margins levels caution for more reasonable expectations. The recent correction may just be an omen.
We haven’t had a year with 17% growth since Mark Zuckerberg launched Facebook.
In this quarterly Earnings Insight series, we focus on key revenue and earnings trends to answering three basic questions: What are the market’s expectations for growth? Are expectations grounded in a reasonable and rational basis? And how much expectation is already priced into the market? Our analysis is based primarily on aggregate forward looking estimates of the S&P 500 Index1 revenue and operating2 earnings.
In this article, we discuss:
- The Latest Earnings Estimates
- Why 2018 Estimates May Be Optimistic
- Valuations Since The January Highs
Note: Numbers may be rounded for ease of reading. Earnings, margins and PE are operating figures as of February 1, 2018.
The Latest Earnings Estimates
I introduced 2018 S&P 500 Index earnings estimates in the November issue of this series. After companies began reporting fourth quarter earnings, 2018 estimates climbed from $144 to over $154. Before focusing on 2018, let’s review 2017 earnings.
2017 Earnings In Perspective

By year’s end, 2017 earnings were estimated at about $125 with the fourth quarter contributing $34.30 (figure-1). Estimates now stand at $124 and $33.47, respectively. Meanwhile, sales growth has accelerated to 9% from 6%. Wait. What?
Shouldn’t higher sales result in higher earnings? It’s important to understand earnings in light of both its sales and margin components. Margins dropped from their earlier estimates more than sales have risen. I discussed why Q4 expectations may disappoint in November’s Earning’s Insight issue.
Putting this in perspective…
Blended3 2017 earnings growth now stands at just under 17%. That’s nothing to sneeze at! We haven’t had a year with 17% growth since 20044. Mark Zuckerberg launched Facebook from his Harvard dormitory that year. And the USB 2.0 flash drive had just become available.
The last year earnings growth exceeded 24% was 1993. The first website went live only two years before.
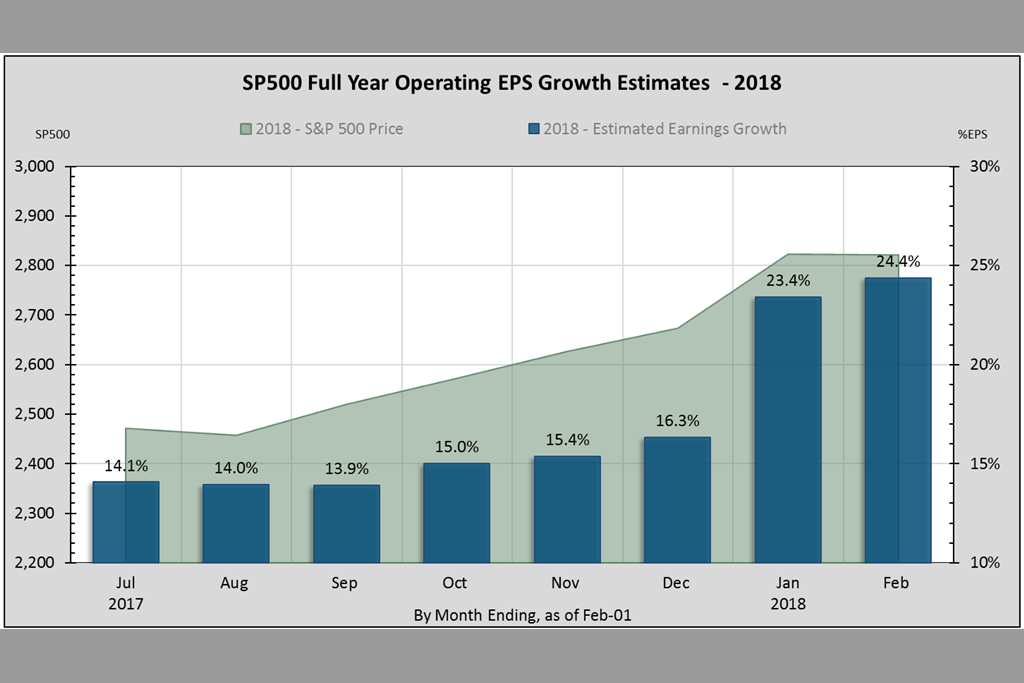
2018 Earnings Estimates Upgraded
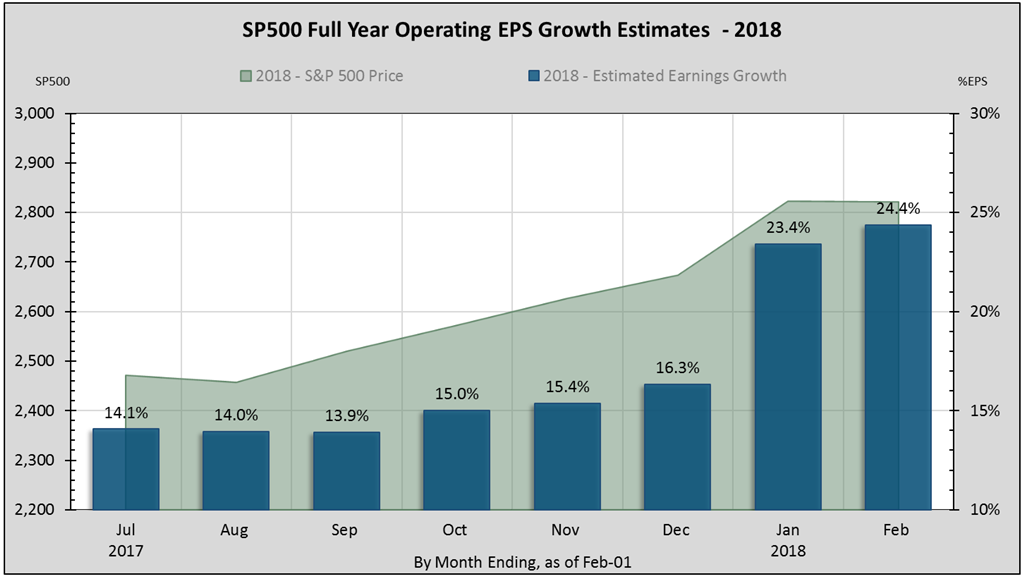
At the end of December, 2018 earnings estimates stood at $145 or 16% over 2017’s blended estimates5. Once fourth quarter reporting commenced, 2018 estimates jumped more than 6% to $154, clocking over 24% growth6.
Putting this in perspective…
The last year earnings growth exceeded 24% was 19934. That year, personal computers sported a whopping 1.44MB 3.5-inch “floppy” drive. In January, there were only fifty Web servers on the planet. In April, CERN put something called the “World Wide Web” software in the public domain. The first website went live only two years before7.
Why 2018 Estimates May Be Optimistic
In last year’s February issue of Earnings Insight I stated, “The likelihood that 2017 earnings will grow 22% over 2016 is optimistic despite the temporary silver lining effect.” I regret to repeat the statement for 2018. Except now the cycle of comparative earnings growth has turned from a tailwind to a stiff headwind.
Fourth quarter earnings suggest 9% sales growth with margins setting a new millennium record for the third consecutive quarter. As I pointed out in December’s Tax Cuts and The Stock Market, “Achieving further earnings growth (in 2018) through margins requires setting new millennium records. Prospects for the market’s uptrend rest almost entirely upon sales.”
Let’s Be Unreasonable
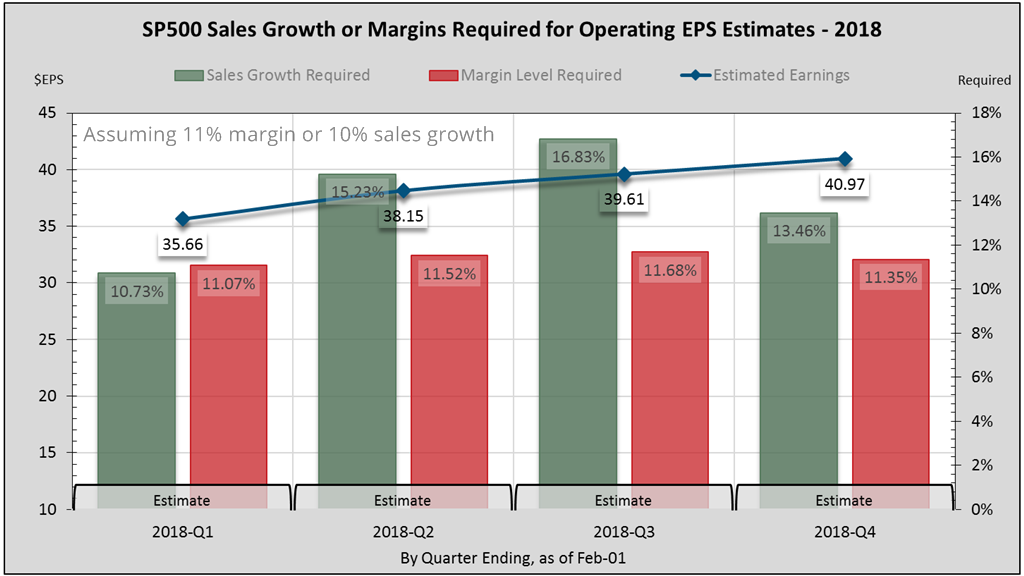
Expecting margin levels to continue higher is unreasonable. Even if margins rise to 11% throughout 2018, sales growth will still have to average 14% to achieve current earnings estimates (figure-3). The highest consecutive 4-quarters we’ve seen this millennium were under 13% in 2005-Q3.
Over the past 16 years, sales growth exceeded 9% only 16% of the time. We had 9-consecutive rolling 4-quarter periods of near or above 9% between 2004 and 2006, and only two in 2011. The median sales growth has been under 6%.
A more reasonable expectation for 2018 is for 10-15% operating earnings growth.
Less unreasonable is margin rising to a record 10.5% with stellar sales growth averaging 10%. Then earnings would grow 15%. Or, if we just maintained fourth quarter’s 10.2% margins at 9% sales growth, 2018 earnings would grow 10%.
More Reasonable Expectations
In my opinion, 24% growth is a stretch, but within the realm of possibility. The wild card here is the future effect of fewer regulations and the tax cuts. Meanwhile, inflation and interest rates are still low by historic measures. And the business-friendly environment is encouraging expansion within the US.
Nevertheless, 10-15% operating earnings growth is a more reasonable expectation for 2018. And that’s mainly due to the margins hurdle8. It’s certainly not pessimistic, but not Pollyannaish either.
Valuations Since The January Highs
If 24% growth for 2018 materializes, then valuations have not necessarily been excessive. But 10-15% earnings growth is perhaps already priced-in. Rising inflation and interest rates, together with declining dividend and earning yields will put further pressure on equity prices.
Had the market’s trend not accelerated in mid-August, the S&P would be about where it closed on February 8.
In 2017, the S&P had been trending upwards at an annual rate of about 14% until mid-August when it accelerated to 25% (figure-4). The trend accelerated again in mid-November, and again in December until the index hit an all-time high of about 2783 on January 26.
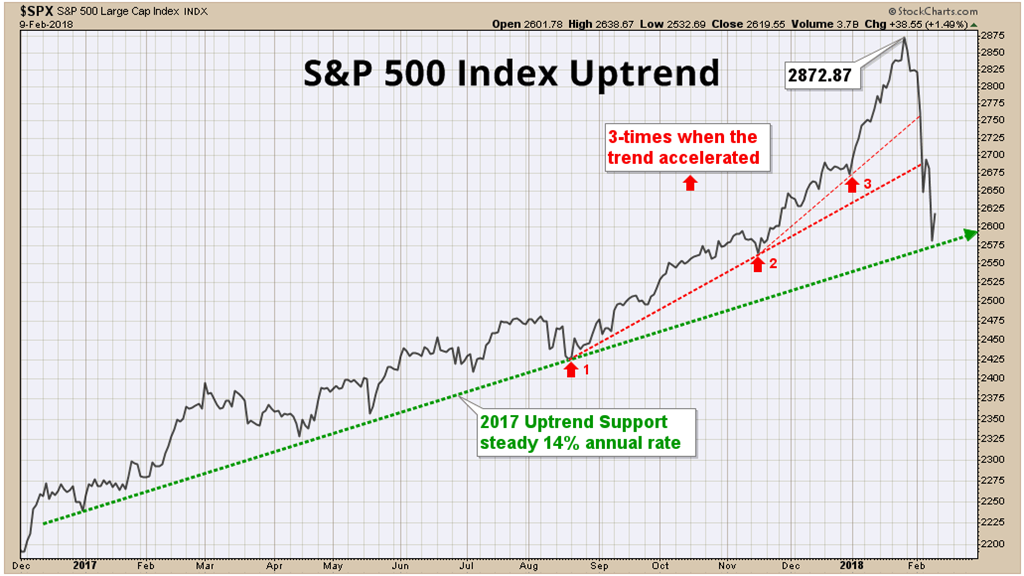
At that time, earnings through 2018-Q2 (2-quarters forward) were estimated at $137.88. January’s high pushed the 2-quarter forward operating PE multiple to over 20-times earnings. On Thursday, February 8, the S&P corrected to a closing low of 2581. By then, estimates through 2018-Q2 had risen to $138.61, and forward PE dropped below 19.
Putting this in perspective…
Had the market’s uptrend not accelerated in mid-August, but continued at the more sustainable 14% annual rate, the S&P would be about where it closed on February 8. Financial news would have suffered a boring week, but investors would be none the worse for wear.
Closing Thoughts
Earnings growth in 2017 has been spectacular. The S&P 500 Index’s price gains came almost entirely from earnings, rather than from rising PE as in recent years. Less regulation and the tax cuts are expected to spur growth.
But a major challenge in the near term is the high margins level, placing the burden of earnings growth more on sales. Strong economic growth can sometimes get in its own way, which is one reason why we experience cycles.
Warm regards,
Sargon Zia, CFA
February 13, 2018
You are welcome to comment!
Recommended Reading:
Manager’s Letter 2017 Q4
Tax Cuts and The Stock Market
More Earnings Insight articles
Published quarterly, the Earnings Insight series provides summary and analysis of material trends in aggregate U.S. company earnings as interpreted by the author and Chief Investment Officer of Coherent Financial Advisers.
How can we help you?

Do you need help with financial planning, investment management or benefits guidance? Contact us for a complimentary call. We look forward to discussing your unique financial goals and personal values!
Footnotes:
- Data source: S&P Dow Jones Indices, us.spindices.com as of February 1, 2018, with about 50% of S&P 500 companies having reported fourth quarter earnings. Therefore, full year 2017 estimated earnings are a blend of 88% actual, and 12% estimated figures. Values are rounded for ease of reading. Analysis and interpretation provided by Coherent Financial Advisers.
- We want to pay attention to real and recurring drivers of company growth, looking past non-cash and accounting related practices. Therefore, we have chosen to analyze operating data where possible, rather than as-reported figures usually cited.
- Blended estimates combine actual reported figures with estimates for those companies not yet having reported.
- Excluding 2010 and 2004 which followed comparatively low post-recession earnings.
- At year-end 2017, fourth quarter earnings had not yet reported. Only Q1-3 earnings were actual numbers while fourth quarter earnings were only an estimate.
- The decline in 2017 blended earnings contributed less than 1% to 2018’s growth estimate.
- See https://home.cern/topics/birth-web. The first website went live on August 6, 1991. The site literally explained what is a website.
- Caveat: If margins reverted to their 15-year median quarterly levels, we would require 12.5% sales growth to maintain zero earnings growth.