Earnings Insight May 2018
Stock market’s character has fundamentally shifted. Gains last year came almost entirely from earnings, and at the lowest volatility in three decades. Earnings growth is at a seven-year high. But future growth depends on margins already at nose-bleed levels.
The S&P 500 Index gained 19.4%, plus dividends, at the lowest volatility in 28-years.
In this quarterly Earnings Insight series, we focus on key revenue and earnings trends1 to help answer three basic questions: What are the market’s expectations for growth? Are expectations grounded in a reasonable and rational basis? And how much expectation is already priced into the market?
In this article, we address these questions as we discuss:
- The Centerpiece of the 2017 Stock Market
- First Quarter Earnings Results – Unbelievable!
- What It All Means For 2018
Note: Our analysis is based primarily on the forward looking aggregate operating earnings estimates of the S&P 500 Index, our stock market proxy, per footnote-1. Earnings, margins, and PE are operating figures. Numbers are rounded for ease of reading.
The Centerpiece of the 2017 Stock Market
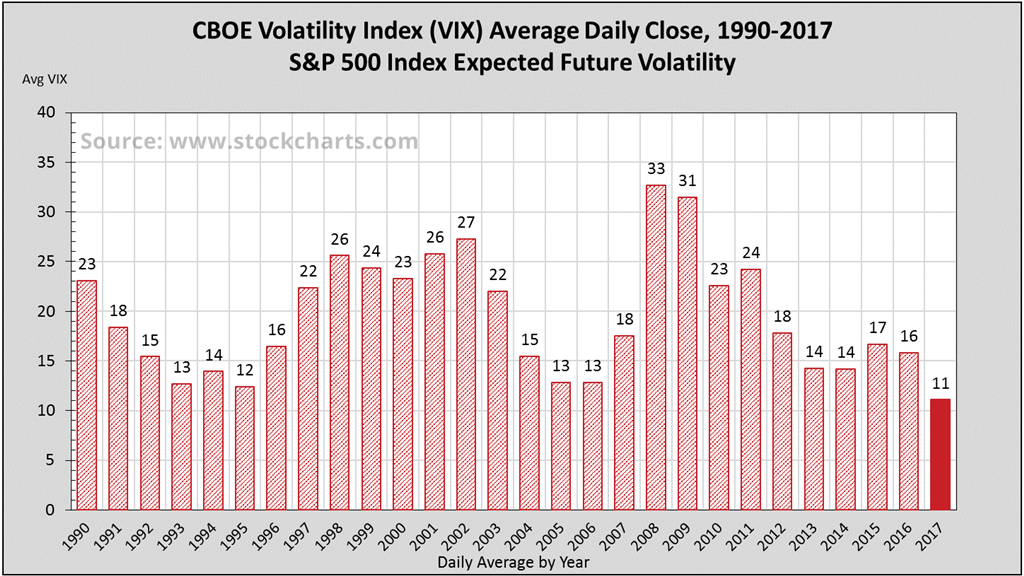
In 2017, the S&P 500 Index gained 19.4%, plus dividends, at the lowest volatility in 28-years (figure-1). Operating earnings grew 17.2% to a new high of $124.51. I want to draw your attention to the driving force behind these returns, as they are relevant to 2018 expectations.
The centerpiece of the 2017 stock market is that 89% of the price gain came from earnings growth.
The stock market’s annual price gain may be attributed to two basic drivers:
- Earnings growth – good
- P/E multiple expansion – bad
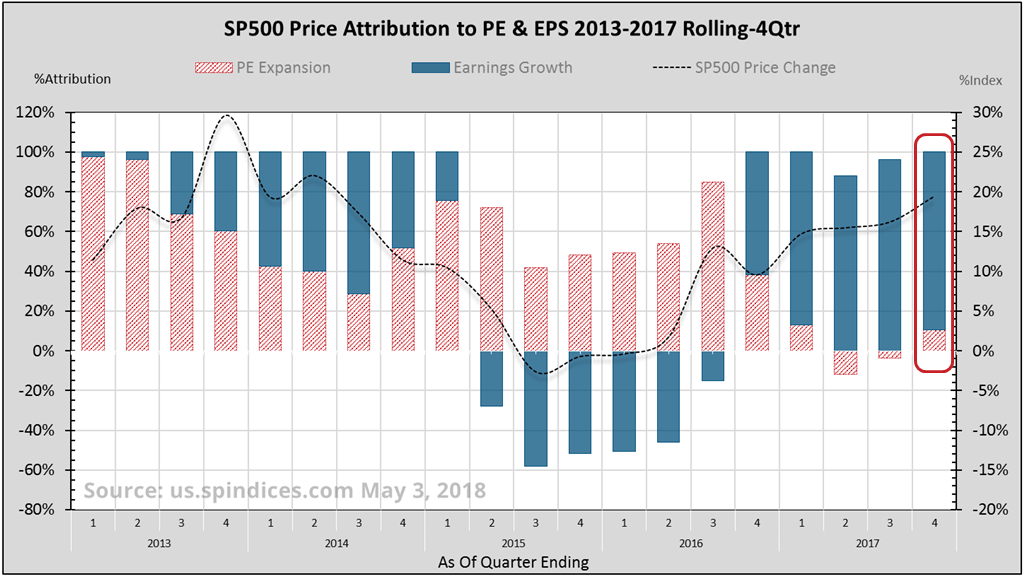
Figure-2 attributes the stock market’s price change (black line) over a rolling 4-quarter period to earnings growth (blue bars) and P/E multiple expansion (red bars). Bars above zero mean the measure contributed to the price change, while below zero detracted.
Note the very last bar representing all four quarters in 2017.
The centerpiece of the 2017 stock market is that 89% of the price gain came from earnings growth. Higher earnings raise the floor under subsequent corrections. Comparatively, 60% of 2013’s 29.6% gain came from P/E multiple expansion, or what I call “stock price inflation”. Fundamentally, 2017 was the better year2.
Fourth Quarter’s Acceleration
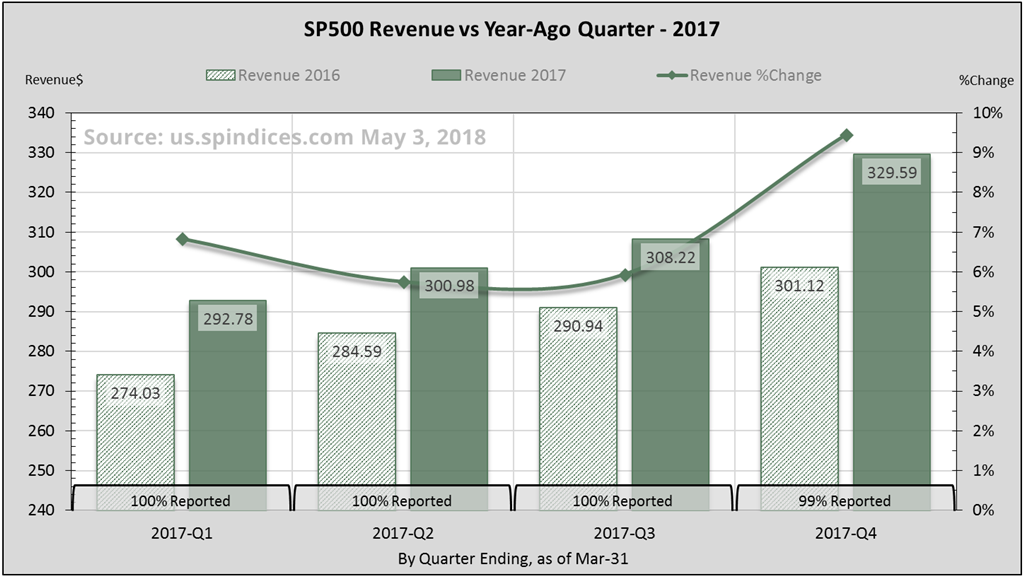
As I expected in November’s article, Q4 earnings came in below analyst’s estimates. But 21% earnings growth, the second-best in seven years, is nothing to sneeze at! Sales blew away expectations and comprised almost half of the earnings growth (figure-3). Information technology and the energy sector contributed significantly.
While technology and energy constitute about 31% of the S&P3, they contributed less than 22% of Q4 revenues. Yet they generated 41% of the quarter’s revenue increase4 over 2016-Q4.
First Quarter Earnings Results – Unbelievable!
Blended first quarter 2018 operating earnings are up nearly 29% over last year. Sales growth is the highest since 2011-Q3, clocking in at 9.5%. For the fourth consecutive quarter, margins have set a new millennium record level of 11.6%. Unbelievable!
This is yet another positive change in the fundamental character of this current market.
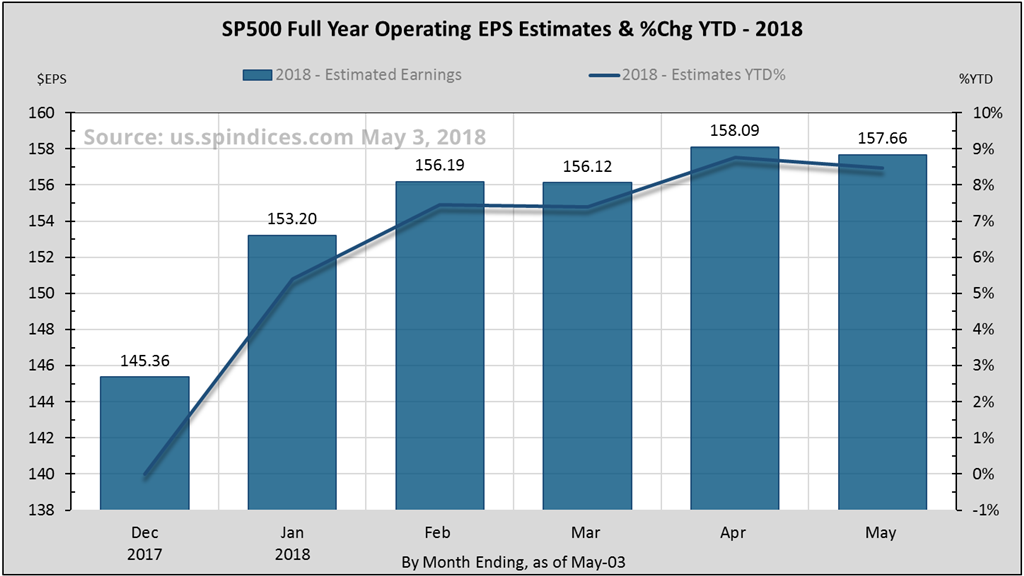
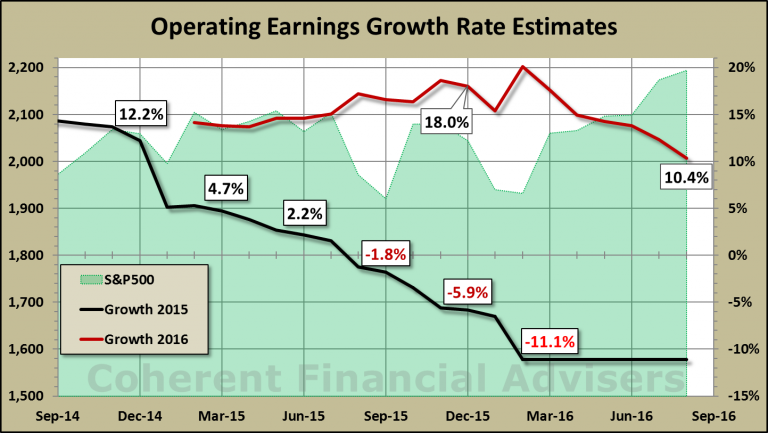
Back in January, as companies began reporting fourth quarter earnings, analysts significantly raised their full year 2018 estimates (figure-4). Full year earnings estimates are now up 8.5% since the start of the year. This is yet another positive change in the fundamental character of this current market.
This time last year, 2017 earnings estimates had dropped almost 2% from the beginning of that year. Similarly, 2016 estimates had dropped 8.6%, and 2015 had dropped over 11%. In contrast, this year’s increase is most refreshing.
What’s driving first quarter earnings?
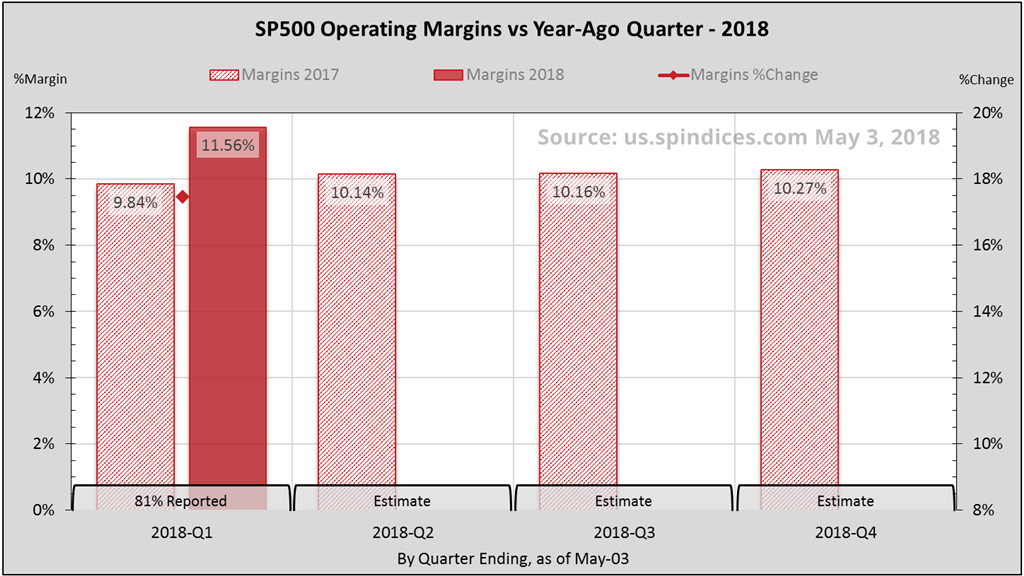
Although sales growth is certainly helping, most of the push is coming from margins (figure-5). Margins are 17.5% higher than a year ago, comprising 60% of Q1’s earnings growth.
On the heels of last quarter’s outstanding performance, technology and energy are again leading contributors to sales growth. They constitute about 31% of the S&P, while contributing less than 21% of Q1 revenue. Yet these two have generated 30% of the quarter’s revenue increase5 over 2017-Q1.
What It All Means For 2018
Current 2018 operating earnings estimates call for 26.6% growth. If 2017 has demonstrated anything, it’s this – raise your expectations! Still, I think current estimates push the boundaries of probability. Margin levels have been rising consistently from their 8% level set in 2015-Q4. The main challenge to 2018 earnings growth is the margins hurdle.

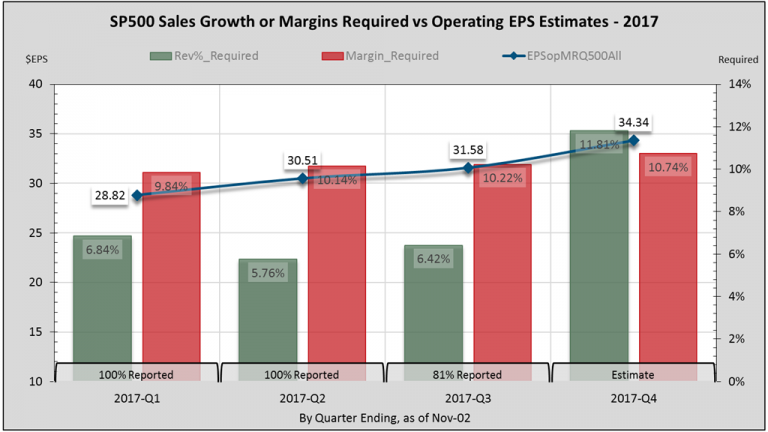
A staple of this Earnings Insight series, figure-6 describes the sales growth or margins level required to meet current analyst’s earnings estimates. It illustrates the challenges facing earnings growth.
Assuming margin levels hold at 10.5%, sales growth will have to average 22%. If sales growth averages 9.5%, margin levels will have to hold above 11.7%. Margin levels are key to realizing analyst’s earnings estimates.
At these nose-bleed levels, the looming margins hurdle will significantly pressure earnings growth.
Rising margins were a significant driver of earnings growth last year. But at these nose-bleed levels, the looming margins hurdle will significantly pressure earnings growth heading into the latter half of this year. Sales growth will present its own challenges later this year. But recent gains in earnings have relieved some of the pressure on valuations.
Coherent’s Call
In February’s Earnings Insight issue, I presented my case for 2018 earnings growth between 10%-15%. If sales growth tracks at 9.5% and margins hold above 10.5%, earnings growth can exceed 15%. If first quarter margins become the trend, we can even exceed 25% earnings growth. The outcome depends largely on margins.
Closing Thoughts
One cannot ignore the elephant in the room. The standard for economic expectations has changed after the US presidential elections. But that’s also replaced the cycle of comparatively easy growth with the margins hurdle. Economic growth can sometimes get in its own way. And this is one reason why we experience stock market cycles.
Warm regards,
Sargon Zia, CFA
May 11, 2018
You are welcome to comment!
Recommended Reading:
Stocks, Bonds & Interest Rates
Tax Cuts and The Stock Market
More Earnings Insight Articles
Published quarterly, the Earnings Insight series provides summary and analysis of material trends in aggregate U.S. company earnings as interpreted by the author and Chief Investment Officer of Coherent Financial Advisers.
How can we help you?

Do you need help with financial planning, investment management or benefits guidance? Contact us for a complimentary call. We look forward to discussing your unique financial goals and personal values!
Footnotes:
- Earnings data from S&P Dow Jones Indices, us.spindices.com as of May 3, 2018, with approximately 80% of S&P 500 companies having reported first quarter earnings. Full year 2018 estimates are a blend of 20% actual, and 80% estimated figures. We want to pay attention to real and recurring drivers of company growth, looking past non-cash and accounting related practices. Therefore, choose to analyze operating data where possible, rather than as-reported figures usually cited. Analysis and interpretation provided by Coherent Financial Advisers.
- In 2017, 17.3% of the price gain (89% of 19.4%) came from earnings growth, versus 11.8% (40% of 29.6) in 2013. Caveat: only 34% of 2017’s earnings growth came from our preferred source – sales growth. The rest came from companies squeezing margins. Less than 22% of 2013’s earnings growth came from sales.
- See S&P Dow Jones Indices, S&P 500 fact sheet pg-4, us.spindices.com as of April 30, 2018.
- S&P 500 Index fourth quarter sales for 2016 and 2017 were $301.12 and $329.59, respectively. Sales contribution was 12.23% and 12.85% from technology, and 7.52% and 8.75% from energy, respectively. Hence, together they contributed 41% of the index’s total change in sales.
- S&P 500 Index first quarter sales for 2017 and 2018 were $292.78 and $320.67, respectively. Sales contribution was 11.13% and 11.92% from technology, and 8.75% and 8.84% from energy, respectively. Hence, together they contributed 30% of the index’s total change in sales.