
Money for Nothing Checks for Free
What we anticipated for 2020 earnings growth was completely supplanted by the spread of the pandemic into our economy. In the face of the unknown, markets began plummeting in late February to discount the worst possible scenario. Earnings estimates for full year 2020 first stabilized some four months later. The earnings fog is beginning to clear, and it isn’t pretty.
The earnings fog is beginning to clear, and it isn’t pretty.
In this quarterly Earnings Insight series, we focus on key earnings trends1 to help answer three basic questions: What are the market’s expectations for growth? Are expectations grounded in a reasonable and rational basis? And how much expectation is already priced into the market?
In this August issue, we address these questions in context of a rare situation that is still developing:
- Current Expectations for Full Year 2020
- The Unusually Uncertain Path to Recovery
- Is The Market Fairly Priced?
Note: Our analysis is based primarily on the forward-looking aggregate operating earnings estimates of the S&P 500 Index, our stock market proxy, per footnote-1. Earnings, margins, and PE are operating figures unless otherwise noted. Values are rounded for ease of reading.
Current Expectations for Full Year 2020
At the start of this year, forward-looking expectation for full year 2020 operating earnings was for 11% growth. But in the first quarter, the situation turned exceedingly volatile as the pandemic spread to the infection of the economy. Current estimates stand at a 35% decline.
Forecasts find a footing
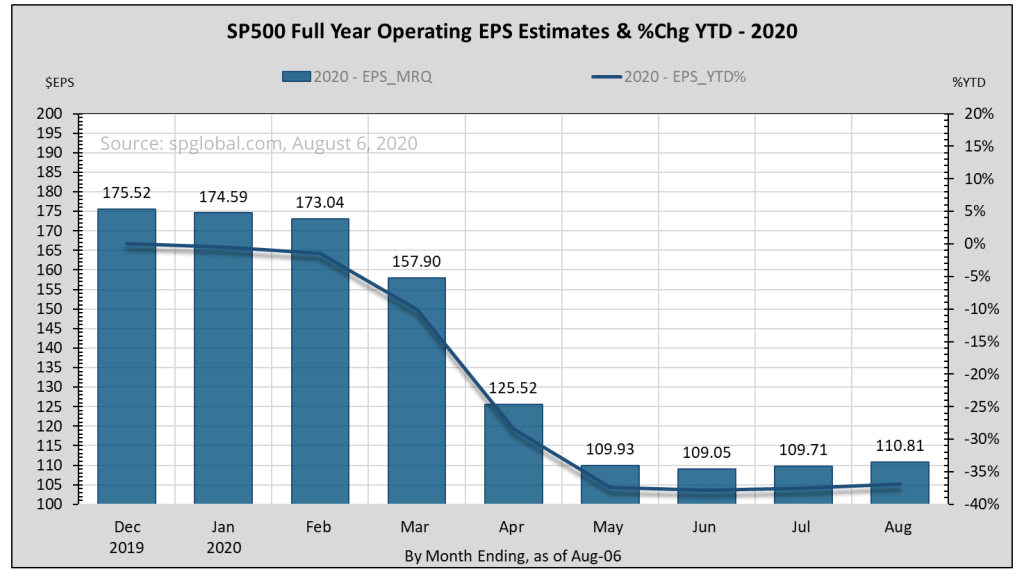
Full year 2020 earnings forecasts began at $175.52 for an 11% increase over 2019 (figure-1). During the first quarter, medical experts formulated possible worst-case public health scenarios from the pandemic. Meanwhile, the S&P 500 Index (S&P) dropped 35% by March 23, reflecting the market’s own guestimate of the effect of the shutdown(s) on earnings.
By late June, full-year 2020 estimates stood at $109 after S&P companies had reported Q1-earnings and the earnings fog began to clear. By August 6, with 89% of Q2 earnings and 47% of full-year 2020 earnings having been reported, the estimate stands at $110.81, a 37% drop year to date.
The market’s 35% preemptive slide appears to have nailed it. But the path to positive growth will be a tough row to hoe.
The market’s 35% preemptive slide appears to have nailed it. But the path to positive growth will be a tough row to hoe.
Tough row to hoe
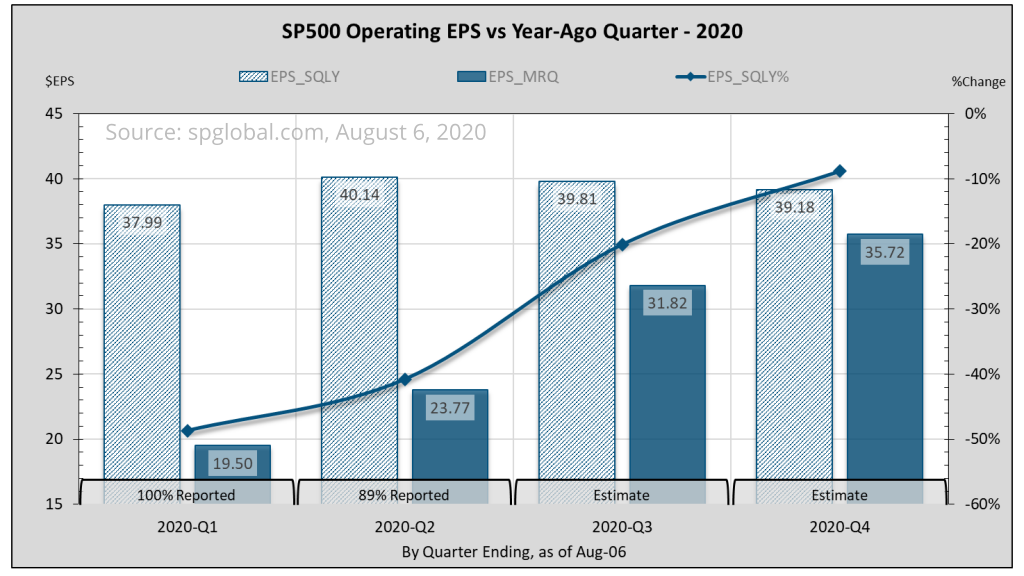
However, the market’s subsequent rally isn’t explained by current estimates for 2020. Figure-2 shows the estimated path for earnings each quarter in 2020 compared with the same quarter last year. With Q1 and most of Q2 already booked, Q3 and Q4 would have to make up the shortfall if earnings were to fully recover this year. But earnings recovery isn’t currently expected before the fourth quarter of 2021.
The Unusually Uncertain Path to Recovery
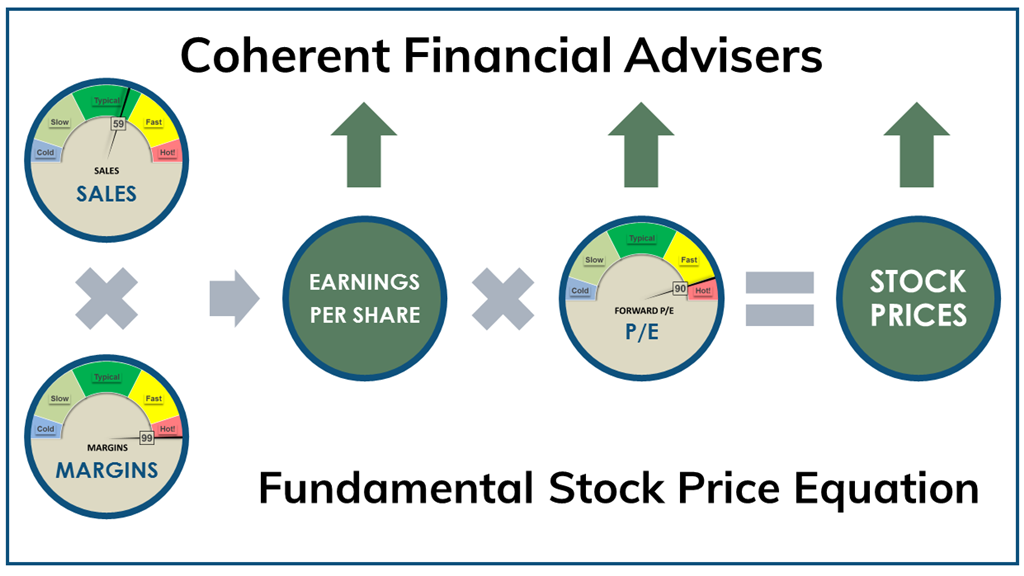
Earnings growth is a product of revenue and margins as demonstrated by our Fundamental Stock Price Equation. With earnings stampeding off a cliff, the outlook for corporate revenue and margin remain unusually volatile. Meanwhile, the Fed is pulling out all the stops, accelerating the supply of nearly free money.
Sales and margins
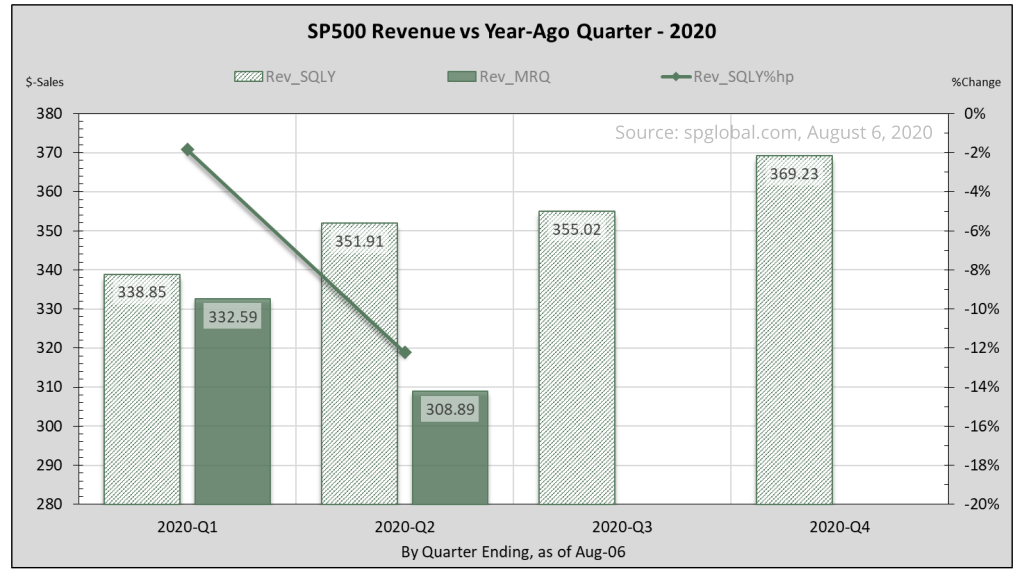
Top line revenue or sales growth tends to contribute less to earnings volatility than changes in margin levels. Figure-3 shows Q2 sales lagging the same quarter last year by over 12%. As the economy reopens, some shortfall to recovery will be made up as pent-up demand snaps back. But some revenue loss will not be recovered, and some businesses will not have survived the shutdowns.
Some revenue loss will not be recovered, and some businesses will not have survived the shutdowns.
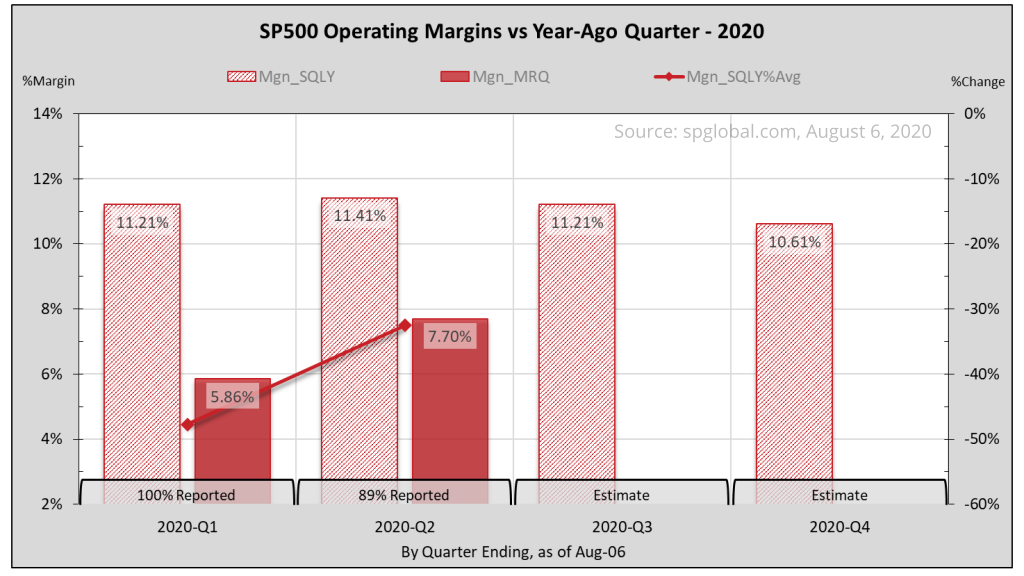
Margin levels tend to contribute more to earnings volatility in part because of the relatively large operating cost leverage2. I explain the margins hurdle in the February 2019 and August 2018 issues of Earnings Insight. Figure-4 shows Q1 and Q2 margins levels have drop well below the same quarters last year by about 40% combined.
Money for nothing, checks for free
After rushing to increase the federal funds target rate3 that sharply inverted the yield curve, the Federal Reserve has been on an easing spree. The Fed dropped the target rate upper limit from 1.75% in late January to nearly zero in two unscheduled releases on March 3 and 15.
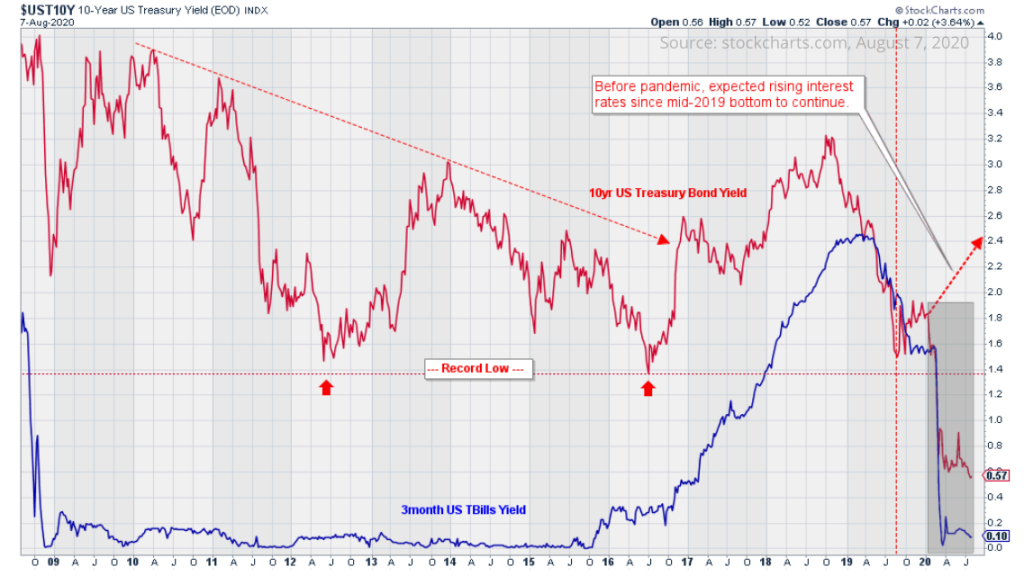
Figure-5 shows the abrupt collapse in interest rates after the 10-year Treasury Bond tested its all-time lows4 (red arrows). By all-time lows I mean since the Bank of the United States5, proposed by Alexander Hamilton, was signed into law by President George Washington in February 1791. And then, rates went lower. The blue line represents the 3-month Treasury Bill rate.
The Fed is pulling out all the stops, accelerating the supply of nearly free money.
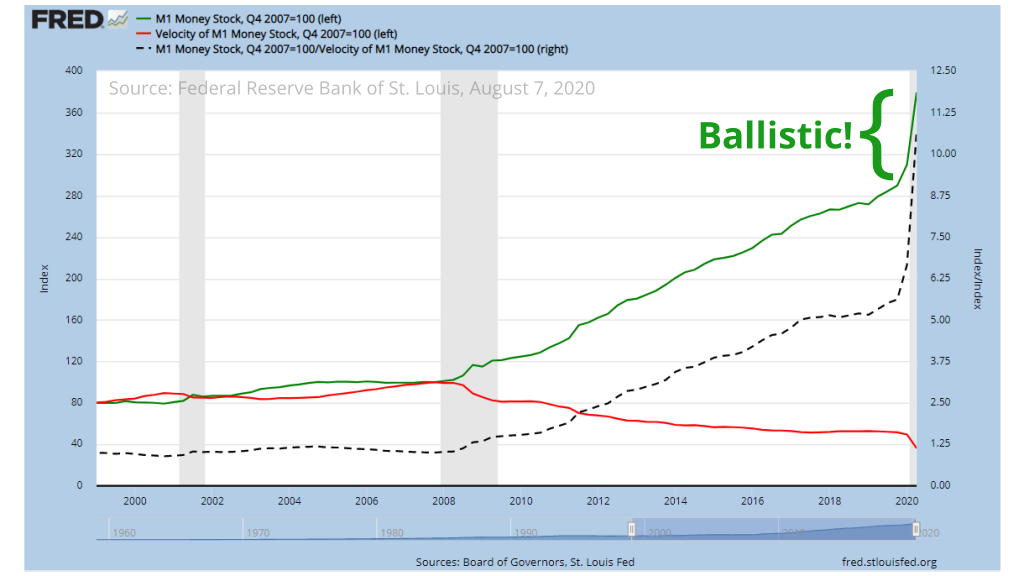
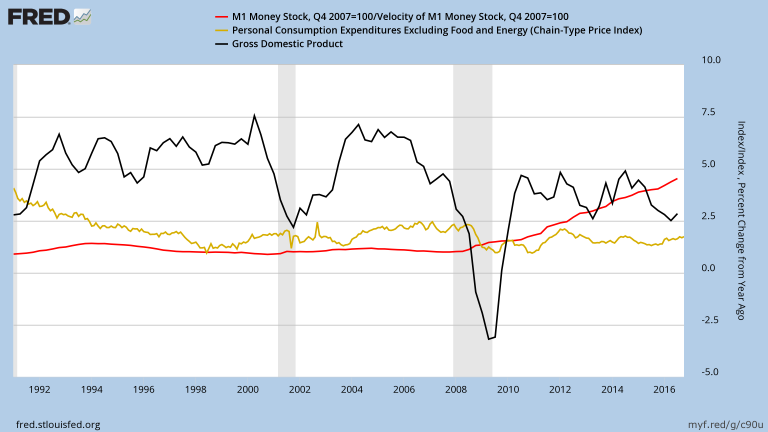
In its latest July 29 statement, The Fed stated it will continue increasing its holdings of Treasury and mortgage-backed securities – translation: increase the money supply. Boy, did it ever! Figure-6 shows the M1 money supply (green) and velocity (red). The nearly vertical trend near the right edge of the chart starts after a decade-long supply increase which came at a significant and persistent clip.
Add to all this the federal government’s fiscal stimulus to ease the fallout from state-mandated unemployment. After-burners are on. We’re going ballistic!
Is The Market Fairly Priced?
Given current expectations for earnings growth, it would seem that the February-March market correction was not too overdone. What is questionable is the subsequent rally to previous highs. This may be attributed largely to government stimulus to back-stop the economy. In terms of valuation alone, perhaps the market has over-corrected its correction.
In terms of valuation alone, perhaps the market has over-corrected its correction.
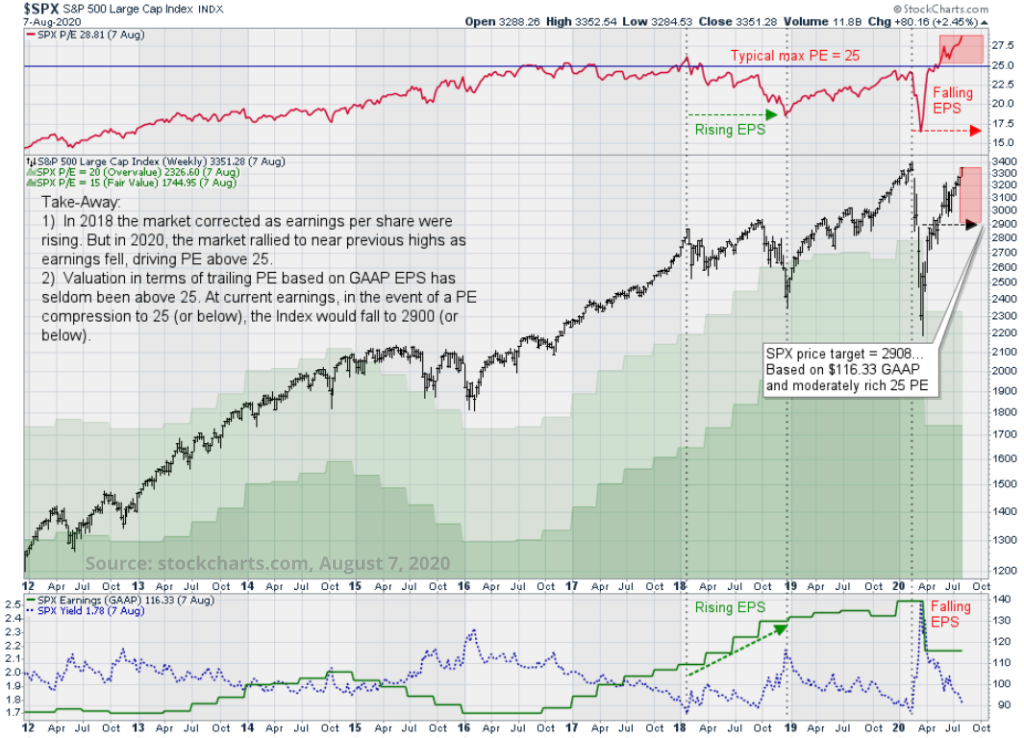
Figure-7 shows the S&P 500 Index since 2012 in black. The green line in the bottom ribbon shows index GAAP6 earnings currently at $116.33. The red line in the top ribbon shows valuation in trailing 12-month P/E ratio7 (currently 28.81) based on GAAP earnings. The light green area in the center chart traces where the index price would be at a constant PE of 20 (currently 2327), and the darker green area traces a PE of 15 (currently 1745).
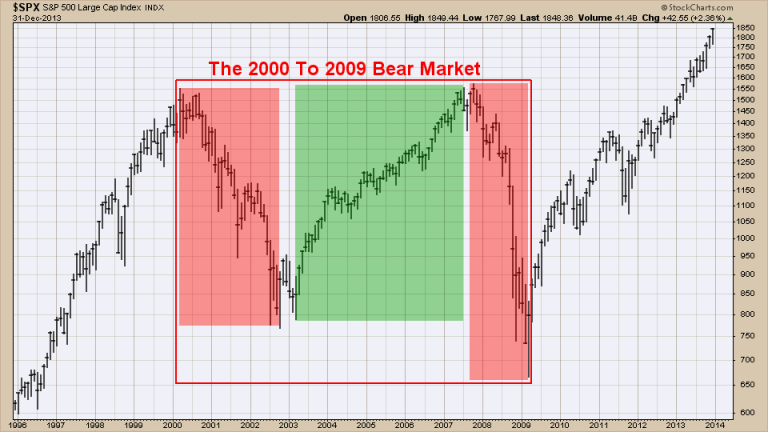
The red PE line has seldom exceeded 25 going back to 1980 with two exceptions: the dot-com bubble in 1998-1999, and when earnings declined during the major bear markets of early 2000 and 2008. Especially worrisome is that while earnings increased briskly during the entire 2018 correction, they fell precipitously as the market rallied from March 2020 lows.
The Take-Away
PE is currently near 29. Should the S&P revert to its moderately rich 25-PE level, its price target would be about 2900, assuming earnings don’t fall further. The price target at the mid-range PE of 20 is 2327. Can earnings rise? Consider that GAAP earnings shown are for the trailing 12-months as of Q1. Full year operating earnings estimates in figure-1 have already fallen 30% from Q1. What do you think?
Closing Thoughts
We are in the midst of a dangerous experiment – the shutting down of the economy by a state-mandated quarantine of the healthy. In desperate times one hopes for more rational solutions, but in my experience, rationality is an unreasonable expectation even in good times.
All things considered, a smaller correction sooner is preferable to a larger one later.
Thankfully, we started with a tremendous lead, a mighty and resilient economy. Earnings and the economy have taken a hit, but they could be much worse – they could have met expert predictions. The economy will recover, but it may take more time than we might wish.
The market has rallied into declining earnings and exceeded historically maximum valuation. That worries me. All things considered, a smaller correction sooner is preferable to a larger one later.
Warm regards,
Sargon Zia, CFA
August 9, 2020
You are welcome to comment!
Recommended Reading:
Climbing A Wall Of Margins
Just One Word – Margins
More Earnings Insight Articles
Published quarterly, the Earnings Insight series provides summary and analysis of material trends in aggregate U.S. company earnings as interpreted by the author and Chief Investment Officer of Coherent Financial Advisers.
How can we help you?

Do you need help with financial planning, investment management or benefits guidance? Contact us for a complimentary call. We look forward to discussing your unique financial goals and personal values!
Footnotes:
- Earnings data sourced from S&P Dow Jones Indices, spglobal.com, as of August 6, 2020, with approximately 89% of S&P 500 companies having reported second quarter earnings. Full year 2020 estimates are a blend of 47% actual, and 53% estimated figures. We want to pay attention to real and recurring drivers of earnings growth, looking past non-cash and accounting related practices. Therefore, we have chosen to focus our analysis on operating data where available, rather than as-reported figures usually cited. Analysis and interpretation provided by Coherent Financial Advisers. Values are rounded for ease of reading.
- Margin: Expenses are typically measured in terms of earnings left over from, and in proportion to sales. Given $100 sales and $92 expenses per shares, margin becomes 8% or $8 per $100 of sales. Increasing margins means decreasing expenses in proportion to sales.
- The target federal funds rate is set by the Federal Open Market Committee or FOMC, the monetary policymaking body of the Federal Reserve System. Composed of 12 members, the FOMC delegates responsibility for implementing U.S. monetary policy, including the effective federal funds rate, to the Federal Reserve Bank of New York through its open market operations.
- All price charts produced using www.stockcharts.com
- See “The First Bank of the United States“, at federalreservehistory.org
- GAAP: Generally Accepted Accounting Principles (GAAP or US GAAP) are a collection of commonly-followed accounting rules and standards for financial reporting. GAAP earnings is not to be confused with “operating earnings” commonly referred to in this Earnings Insight series. See cfainstitute.org article for more information.
- Price/Earnings ratio, or PE = Price divided by Earnings; 3351.28 / $116.33 = 28.81.

