Earnings Insight August 2018
Earnings continue their record-breaking trend. S&P 500 price gains have been driven by earnings growth as overall valuation has subsided. Record margin levels contributed half the earnings growth, but may be the main drag in 2019.
If 2017 has demonstrated anything, it’s this – raise your expectations!
In this quarterly Earnings Insight series, we focus on key earnings trends1 to help answer three basic questions: What are the market’s expectations for growth? Are expectations grounded in a reasonable and rational basis? And how much expectation is already priced into the market?
In this article, we address these questions as we discuss:
- Record-Breaking Trends Continue
- Earnings Expand, Valuations Contract
- Top-2 Sectors Driving Revenue Growth
Note: Our analysis is based primarily on the forward-looking aggregate earnings estimates of the S&P 500 Index, our stock market proxy per footnote-1. Earnings, margins, and PE are operating figures. Numbers are rounded for ease of reading.
Record-Breaking Trends Continue
I said in May’s Earnings Insight article, “If 2017 has demonstrated anything, it’s this – raise your expectations!” I must confess, I am still struggling with this. The long stretch of over-optimism and lowered expectations dulled my outlook. The recent record-breaking trend will help cure that.
The first two quarters set a new earnings growth record for the seven years since 2011.
Second Quarter Earnings and Full Year Estimates
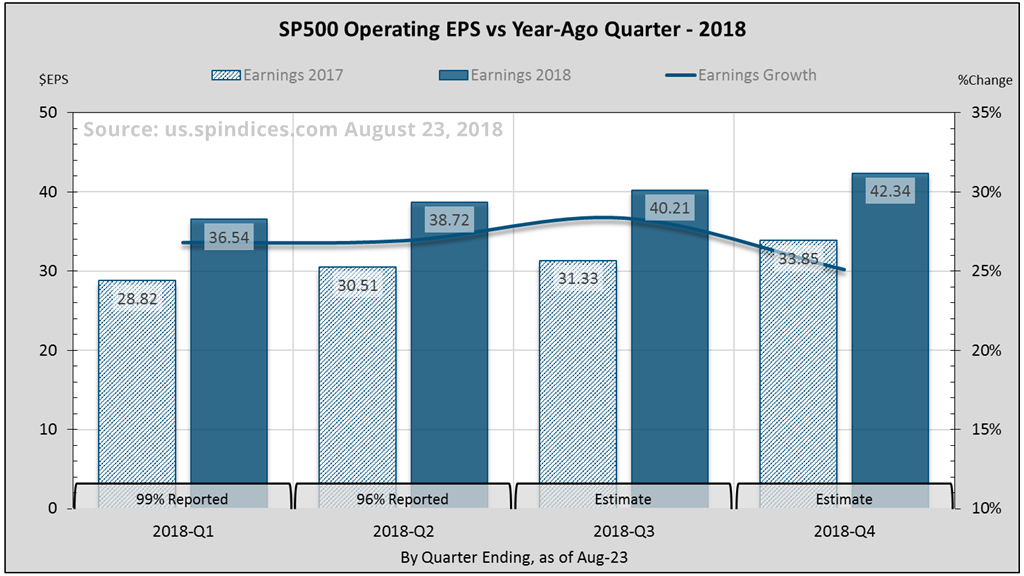
Full year 2018 estimated growth stands at 27% or $158 per share. The first two quarters set a new earnings growth record for the seven years2 since 2011.
First quarter operating earnings grew 26.8% over 2017-Q1 which itself was up over 20%. Second quarter blended growth is approaching 27% (figure-1).
What’s been driving second quarter earnings?
Record Revenue and Margins
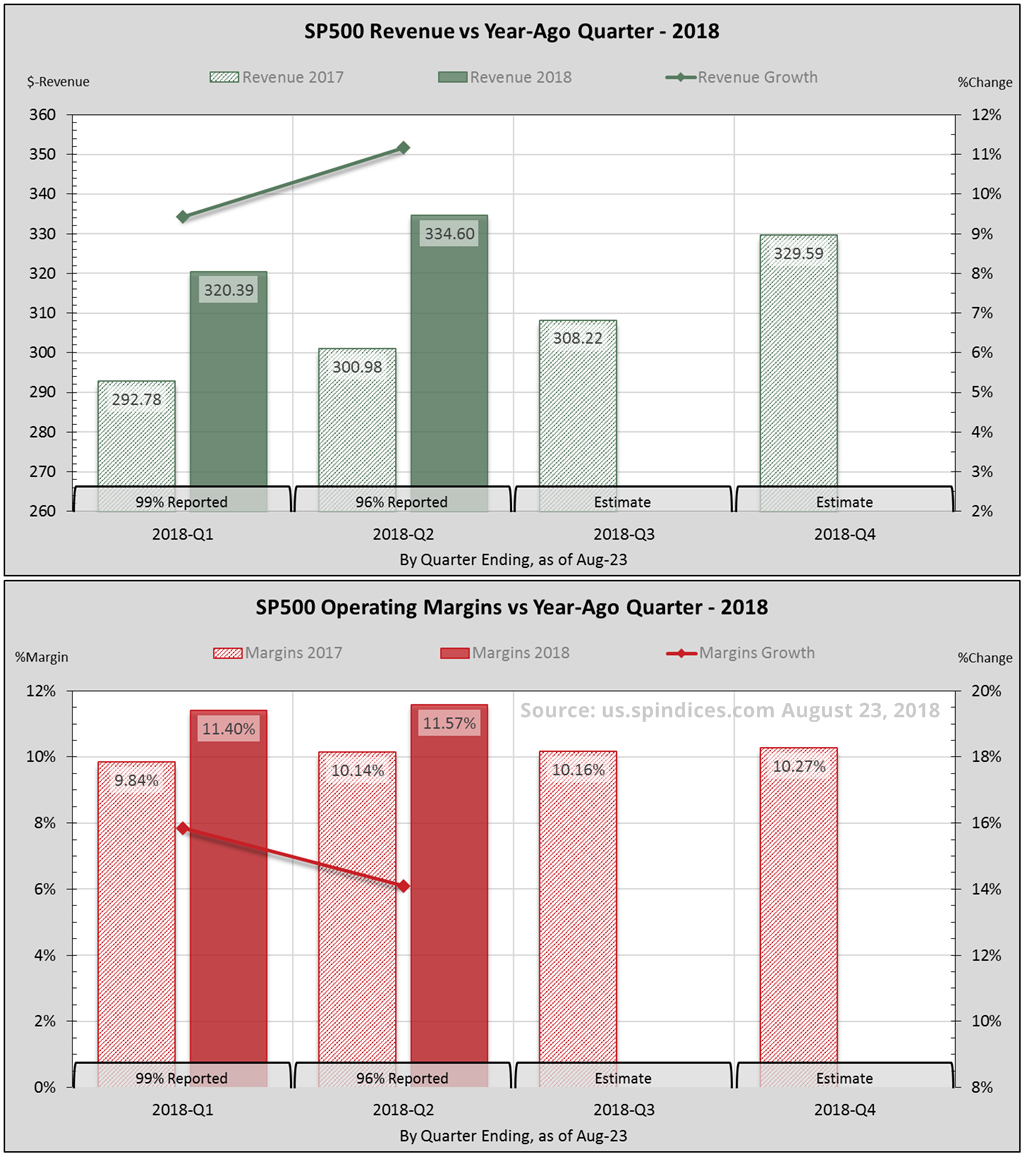
Blended second quarter revenue grew 11.2%, a seven-year record. It’s also the first double-digit growth since turning positive in 2016-Q1 (figure-2).
Meanwhile, operating margin is on track for a fifth consecutive millennium record 11.6%. This is 14% higher than 2017-Q2, which itself was record. Again, unbelievable!
Earnings growth is a product of revenue and margins as demonstrated by our Fundamental Stock Price Equation. Revenue growth at 11% and margin growth at 14% produce earnings growth at 27% (1.11 x 1.14 = 1.27).
How has earnings growth affected index-level valuation?
Earnings Expand, Valuations Contract
The stock market’s annual price gain may be attributed to two basic drivers:
- Earnings growth – that’s good
- P/E multiple expansion – that’s bad
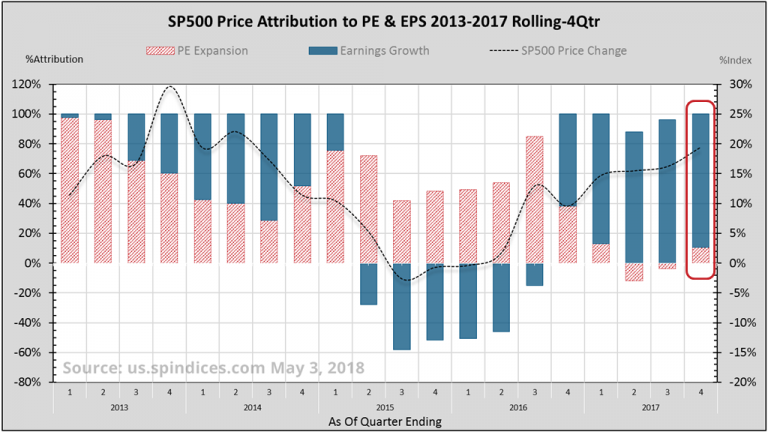
The centerpiece of the 2017 stock market was that 89% of the price gain came from earnings growth, and 11% from PE expansion. Figure-3 illustrates that this has gotten even better!
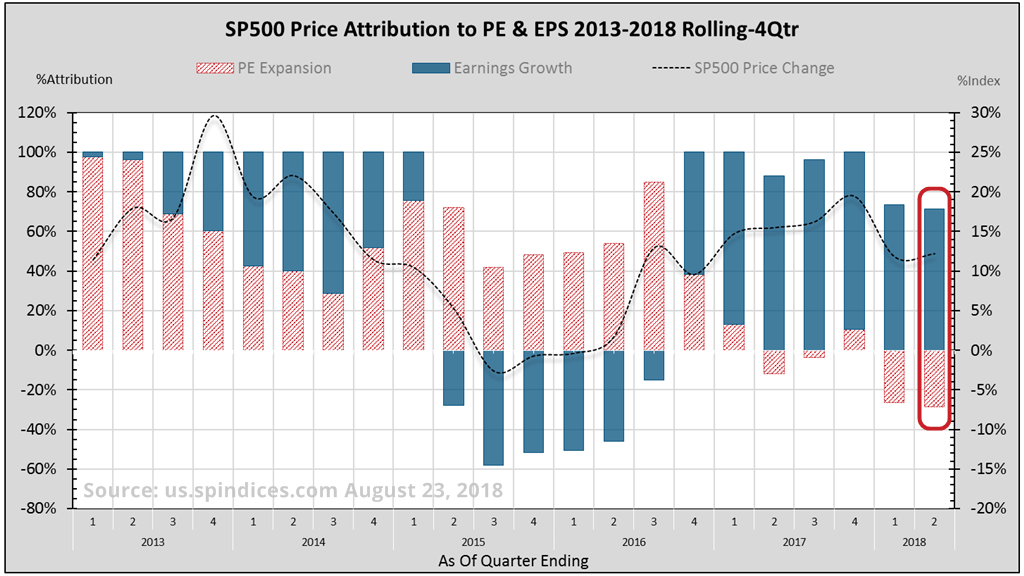
In the four quarters ending June (last bar), the S&P gained 12% while earnings rose 21%. Thus 167% of the price gain came from earnings expansion (blue bars), and 67% from PE compression (red bars). Earnings expanded as valuation contracted.
Higher earnings raise the floor under subsequent corrections.
Higher earnings raise the floor under subsequent corrections. Consider that the trailing PE as of the March 2009 lows was 15.5. With earnings now at $158, the S&P would be at 2450, just 15% below recent highs.
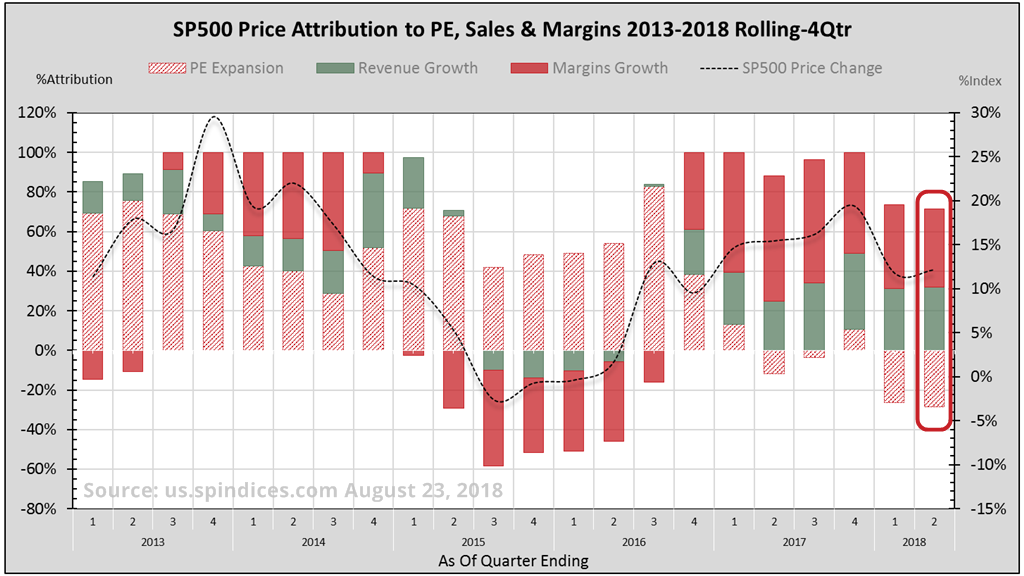
Figure-4 breaks down the earnings contribution into its two components. We see that 55% of the earnings growth came from margins (solid red bars) and 45% from revenue (green bars). Though not ideal, this is expected when earnings accelerate after periods of relatively lower growth.
What’s been driving the S&P’s revenue and margin growth?
Top-2 Sectors Driving Revenue Growth
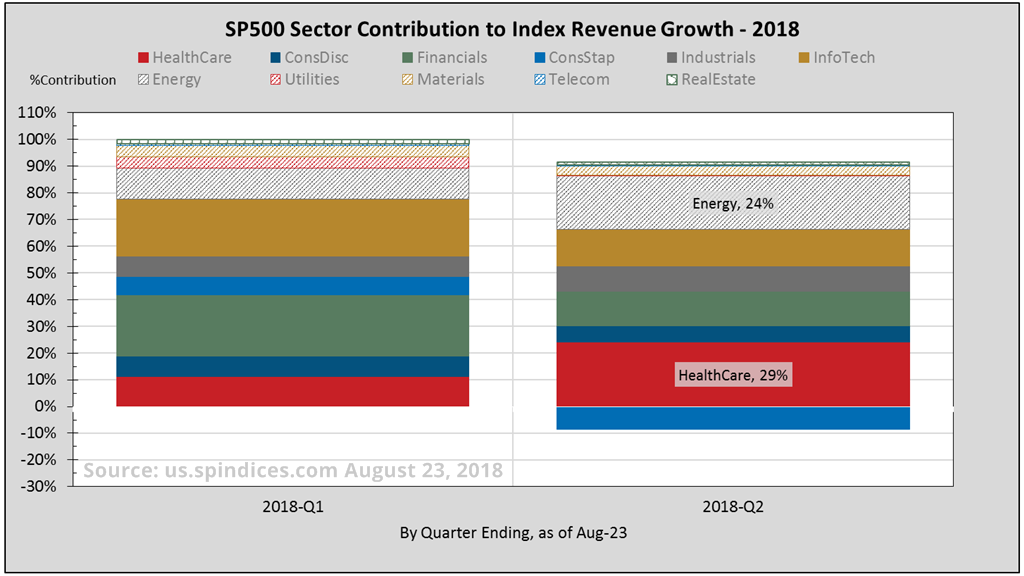
Of the eleven S&P sectors, health care and energy comprised3 53% of the index’s 11.2% revenue growth in 2018-Q2 (figure-5). Drilling into these sectors helps to understand how revenue and margin affect earnings growth.
But first, a primer on the three components of revenue…..
Three Components of Revenue
By definition, a company’s variable costs fluctuate proportionately with revenue while fixed operating costs remain relatively constant. Operating income is revenue less these expenses. (Operating margin is operating income measured as percentage of revenue). These three are the main components of revenue.
When revenue picks up after a cycle of contraction, operating income increases disproportionately faster. Revenue and margin growth together multiply earnings growth. This is what we’ve been experiencing since 2016-Q3.
Now, let’s drill down…..
The Health Care Sector

Johnson & Johnson (NYSE:JNJ) and UnitedHealth Group Inc (NYSE:UNH) comprise 17.5% of the health care sector. Figure-6 parses their three revenue components.
As revenue grew 11.7% in 2018-Q2, both variable and fixed operating costs grew 12.5%. Consequently, operating margin contracted 5% from the year-ago quarter. Had fixed costs remained fixed, operating margin would have grown 15%, a 20% differential!
Contracting margins muted4 earnings growth from 27% to only 5.9%.
The Energy Sector
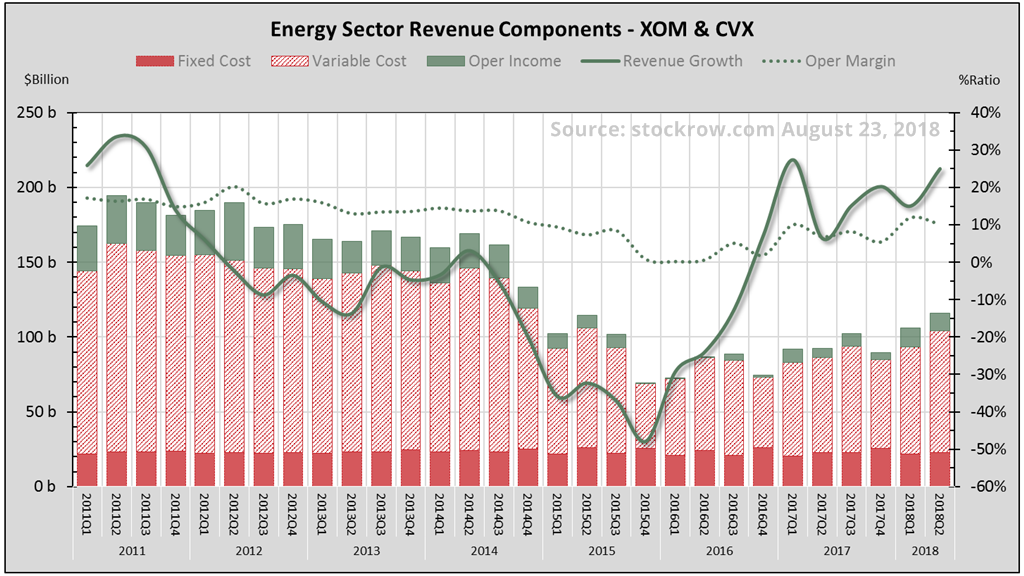
Exxon Mobil Corporation (NYSE:XOM) and Chevron Corporation (NYSE:CVX) comprise 40% of the energy sector. Figure-7 parses their three revenue components.
By mid-2016, operating income had vanished as revenues contracted. Revenue growth then turned positive in 2017, increasing to 25% in 2018-Q2. As fixed operating costs remained flat, operating margin expanded 50% over the same quarter last year.
Expanding revenue and margins multiplied for 87% earnings growth5.
The Take-Away
Health care and energy contributed significantly to the S&P’s revenue growth. While expanding margin produced outstanding earnings growth in energy, contracting margin stifled it in health care.
Where does this lead us for 2018 and beyond?
Closing Thoughts
The first half of this year has outpaced 2017 growth far beyond my expectations. At current record revenue and margin growth rates, we can achieve 26% operating earnings growth for 2018. Even if revenue and margins drop to their 4-quarter average of 9% and 10.9%, respectively, earnings will grow 21% given the stellar first half.
But margins are a cyclical or mean-reverting animal. At current nose-bleed record levels, the looming margins hurdle will significantly pressure earnings growth heading into 2019.
Warm regards,
Sargon Zia, CFA
August 27, 2018
You are welcome to comment!
Recommended Reading:
Stocks, Bonds & Interest Rates
Tax Cuts and The Stock Market
More Earnings Insight Articles
Published quarterly, the Earnings Insight series provides summary and analysis of material trends in aggregate U.S. company earnings as interpreted by the author and Chief Investment Officer of Coherent Financial Advisers.
How can we help you?

Do you need help with financial planning, investment management or benefits guidance? Contact us for a complimentary call. We look forward to discussing your unique financial goals and personal values!
Footnotes:
- Earnings data from S&P Dow Jones Indices, us.spindices.com as of August 23, 2018, with approximately 96% of S&P 500 companies having reported second quarter earnings. Full year 2018 estimates are a blend of 49% actual, and 51% estimated figures. We want to pay attention to real and recurring drivers of company growth, looking past non-cash and accounting related practices. Therefore, choose to analyze operating data where possible, rather than as-reported figures usually cited. Analysis and interpretation provided by Coherent Financial Advisers.
- Coming out of the correction bottom in 2009 gave 2010 a relatively easy growth hurdle.
- S&P 500 Index second quarter sales for 2017 and 2018 were $300.98 and $334.60, respectively. Sales contribution was 16.5% and 17.7% from health care, and 8.0% and 9.6% from energy, respectively. Hence, together they contributed 53% of the index’s total change in sales.
- Revenue grew 11.65% and margins contracted 5.13%, producing 5.92% earnings growth (1.1165 x 0.9487 = 1.0592, or 5.92%).
- Revenue and margins growth of approximately 25% and 50%, respectively produces 87% earnings growth (1.25 x 1.50 = 1.87, or 87%).