Climbing A Wall Of Margins
While earnings growth in 2018 is on track to setting a new millennium record, it has also become and a major hurdle to growth in 2019. Current 2019 estimates call for a third of the growth in 2018, and the trend is declining. There’s seldom a shortage of bricks for the market’s wall of worry. The mortar holding them together this year is margins.
There’s seldom a shortage of bricks for the market’s wall of worry. The mortar holding them together this year is margins.
In this quarterly Earnings Insight series, we focus on key earnings trends1 to help answer three basic questions: What are the market’s expectations for growth? Are expectations grounded in a reasonable and rational basis? And how much expectation is already priced into the market?
In this February article, we address these questions as we discuss:
Note: Our analysis is based primarily on the forward-looking aggregate operating earnings estimates of the S&P 500 Index, our stock market proxy, per footnote-1. Earnings, margins, and PE are operating figures. Values are rounded for ease of reading.
Record 2018 Growth Might Hurt 2019
Earnings growth in 2018 is setting a new millennium record. Rising margins2 have contributed significantly to earnings growth in recent years, and 2018 is no exception. But exceptional growth in one year becomes a hurdle to growth in the next.
If margin levels materially decline, 2019 earnings growth will be at risk.
Record 2018 performance
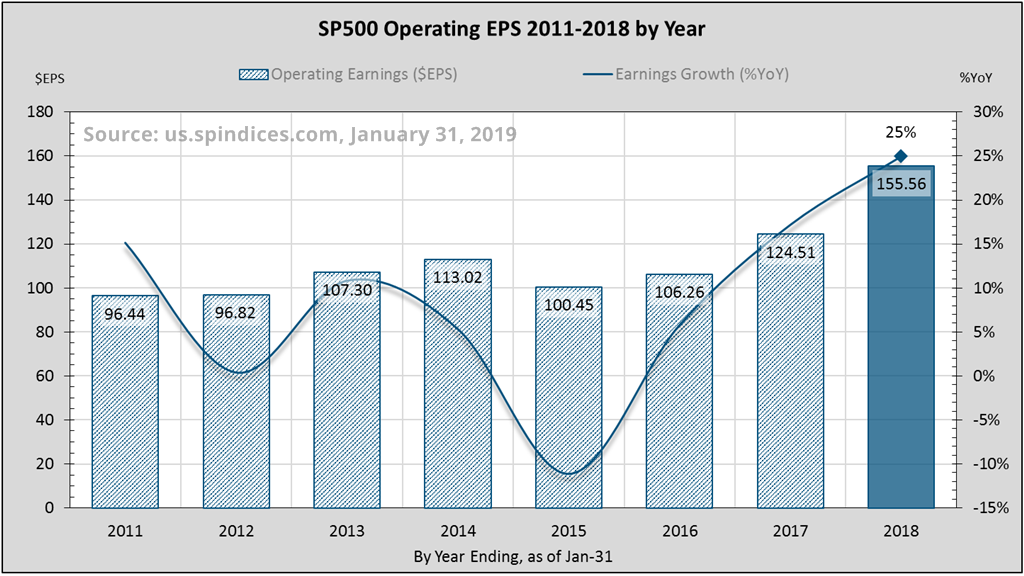
S&P 500 companies are on track to deliver a calendar year millennium record 25% earnings growth3 for 2018 (figure-1). Last year will also set a millennium record for the highest margins and the fourth largest sales growth. The third quarter already holds the millennium quarterly record of 32% earnings growth4, and 12% margins!
This was no easy feat. Comparative 2017 earnings set a very high hurdle with millennium record margin levels and the second highest post-recession sales growth. This is like winning back to back Super Bowls.
How might 2018 performance hurt 2019?
The market measures growth by comparing one year to the previous year, one quarter to the same quarter last year. Performance in one period becomes the hurdle for growth in the next. Hence a year like 2010 which follows a recession would be expected to deliver high growth rates in sales, margins, and consequently earnings, while 2019 would not.
Higher margins contributed 60% of the earnings growth in 2018. If margins had been flat, 2018 earnings would have grown only 9% from sales. Margins, which are cyclical in nature, reached their highest level in 18-years. If margin levels materially decline, 2019 earnings growth will be at risk. More on this later.
The Current Outlook For 2019 Earnings
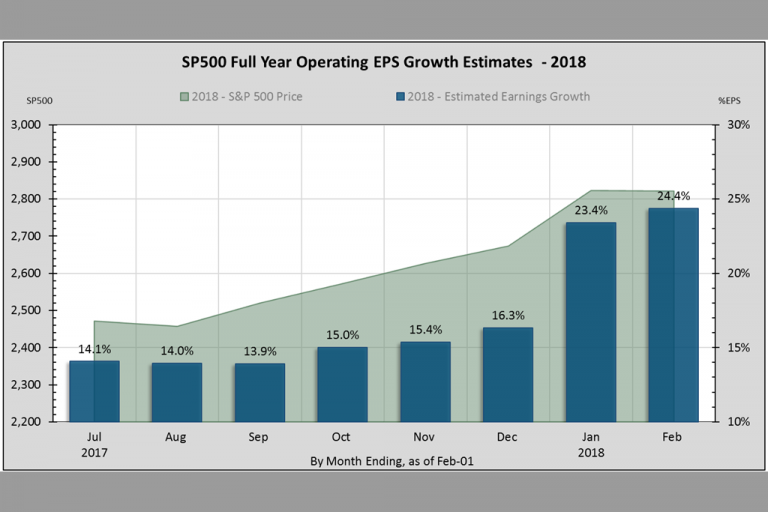
Analyst estimates for 2019 operating earnings growth have been less than half those in 2018 at best. Growth estimates have declined sharply since October which may in part explain the recent stock market correction. Record 2018 margins are presenting a major hurdle to earnings growth.
Growth estimates have declined sharply since October which may in part explain the recent stock market correction.

By the end of October, all S&P 500 companies had reported second-quarter earnings. At that time, analysts estimated 2019 earnings growth at 12%, less than half that for 2018. In my experience, analysts as a group generally tend to project current trends to continue into the future. But the lower estimates did not surprise me given my view on margin levels since late 2017.
Since October, 2019 earnings growth estimates have been declining sharply (figure-2). Growth estimates dropped to 9.4% in December. It is interesting to note that during this same period the stock market corrected 20% as growth estimates declined 23% (from 12.2% to 9.4%).
As of the end of January, full year 2019 earnings estimates stand at just 8% increase over current 2018 estimates. By itself, 8% earnings growth is not bad considering that the annualized rate for the past eight years5 has been 8% (that’s a lot of “eights”).
But why the big drop from 25% growth to 8%? Just one word – Margins!
Climbing A Wall Of Margins
Margin levels in 2018 will have a major influence on 2019 operating earnings. The tailwind effect from relatively easy comparable earnings growth evaporated by mid-2017. Now in full effect, the margins hurdle has become the mortar in the market’s wall of worry in 2019.
Without help from margins, operating earnings growth may fall below the current 8% estimate, or may even contract.
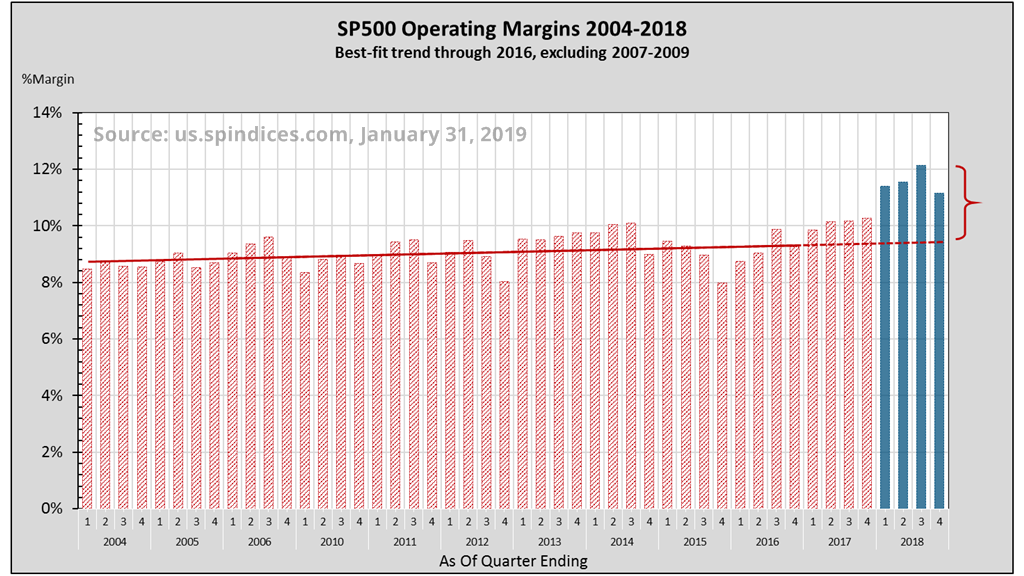
In the 13-years from 2004 through 2016, excluding 2007-2009, operating margin levels have trended virtually flat (red line, figure-3). But 2018 margin levels have risen significantly above this long-term trend (blue bars), becoming the margins hurdle for 2019.
Whether the market can realize 8% earnings growth this calendar year will depend on margin levels and sales growth. Sales and margins growth combined produce earnings growth6. Sales growth exceeded 8% in only 5 of the last 18-calendar years, averaging7 less than 5%. But let’s assume revenues grow 8%. Then, margins growth can remain flat by maintaining at least an 11.5% level on average.
However, margin levels have already dropped below 11.5% in the fourth quarter. Hypothetically, if margins decline gradually to the trend rate shown in figure-3, they would contract 11% from 2018 levels8. At the 8% sales growth assumption, earnings would contract 2%.
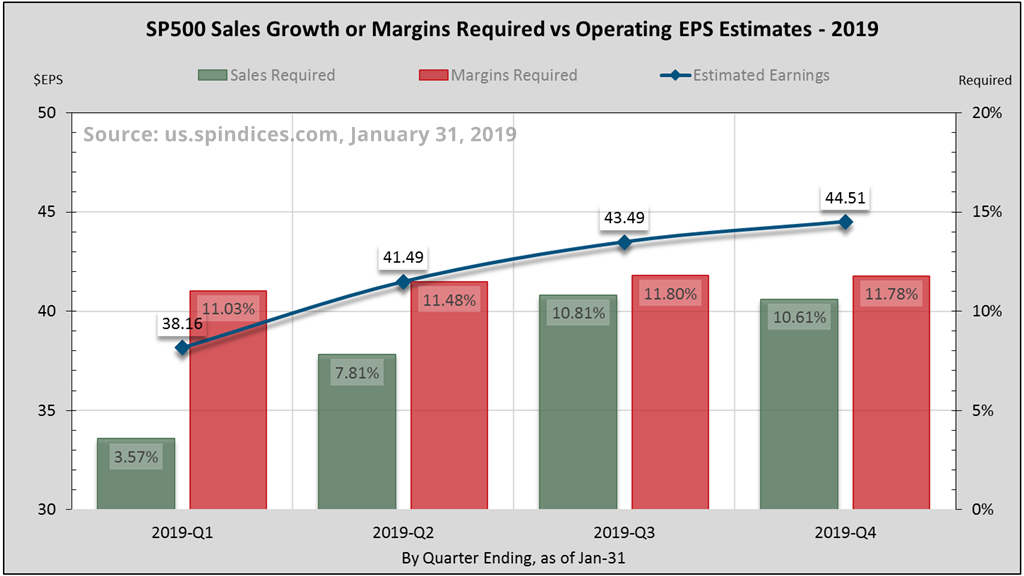
Figure-4 shows the sales growth required at 11.5% margins, or conversely the margins level required given 8% sales growth in order to achieve current earnings estimates for each quarter.
Closing Thoughts
Current estimates of 8% operating earnings growth in 2019 are well within the realm of possibility. I think growth in the 3-5% range is a more reasonable expectation, mainly due to the margins hurdle. Last quarter’s stock market correction may have priced in this lower growth rate, but perhaps not too much lower.
Margins will be an important determinant of earnings growth in 2019. Without help from margins, operating earnings growth may fall below the current 8% estimate, or may even contract. As I’ve often said, growth can sometimes get in its own way, which is one reason why we experience stock market cycles.
Warm regards,
Sargon Zia, CFA
February 6, 2019
You are welcome to comment!
Recommended Reading:
Just One Word – Margins
Dropping The Ball For 2018
More Earnings Insight Articles
Published quarterly, the Earnings Insight series provides summary and analysis of material trends in aggregate U.S. company earnings as interpreted by the author and Chief Investment Officer of Coherent Financial Advisers.
How can we help you?

Do you need help with financial planning, investment management or benefits guidance? Contact us for a complimentary call. We look forward to discussing your unique financial goals and personal values!
Footnotes:
- Earnings data from S&P Dow Jones Indices, us.spindices.com, as of January 31, 2019, with approximately 43% of S&P 500 companies having reported fourth quarter earnings. Full year 2018 estimates are a blend of 85% actual, and 15% estimated figures. We want to pay attention to real and recurring drivers of earnings growth, looking past non-cash and accounting related practices. Therefore, we have chosen to analyze operating data where possible, rather than as-reported figures usually cited. Analysis and interpretation provided by Coherent Financial Advisers. Values are rounded for ease of reading.
- Margin: Expenses are typically measured in terms of earnings left over from, and in proportion to sales. Given $100 sales and $92 expenses per shares, margin becomes 8% or $8 per $100 of sales. Increasing margins means decreasing expenses in proportion to sales.
- Excluding 2010. As the US economy came out of its last GDP-based recession in the second half of 2009, it was natural that the stock market should deliver high earnings growth in 2010. Comparatively, 2009 sales and especially margins levels provided a low hurdle for generating earnings growth.
- The previous record was set in the third quarter of 1993 when earnings grew 35%. We are excluding 2010 which followed a severe earnings recession which set an unusually low performance hurdle.
- In the 8-years after 2010 (i.e. 2011-2018), S&P 500 Index operating earnings grew from $83.77 to a blended $155.56 for an annualized rate of 8.04%.
- Sales and margins growth combined produce earnings growth. For example, using blended Q4 growth estimates of 8.5% from margins plus 6% from sales produced approximately 14.5% earnings growth (more accurately 1.085 x 1.06 = 1.15, or 15%).
- In the past 18-years (i.e. 2001-2018), S&P 500 Index revenue grew from $745.70 to $1,346.23 for an annualized rate of 3.34%. The average same-quarter change was 5.58%, rolling 4-quarter change was 4.81%, and average calendar year change was 3.54%.
- Extending the long-term margins trend from 2016 through 2019 reaches about 9.5%. Declining gradually from 2018’s average 11.6% to 9.5% approximates an average margin level of 10.3% for 2019, which is 11% below that in 2018.