
Earnings Insight May 2017
The French elections have become another “uncertainty” fading into the market’s rear view mirror. French journalist Jean-Baptiste Alphonse Karr1 once said, “The more it changes, the more it’s the same thing.” Established market principles cannot be simply voted out. Like gravity, fundamental forces eventually, rudely, yank investors back to reality.
“The more it changes, the more it’s the same thing.”
In Earnings Insight articles, we focus on key revenue and earnings trends2. To capture the essence of earnings season, we bypass the minutia and focus on three high-level questions. What are the market’s expectations for growth? Are expectations grounded in a reasonable and rational basis? And how much expectation is already priced into the market? We study answer to these questions while discussing:
Turning From Worst To Best
We Americans love our superlatives! Seven consecutive quarters of contracting growth took home “worst-since” awards, until the third quarter of 2016. Fourth quarter saw the best operating earnings growth since 2013-Q4. And the first quarter is shaping up to be the best since 2010-Q4. We’ve turned a corner from “worst since” to “best since”, and that’s refreshing news!
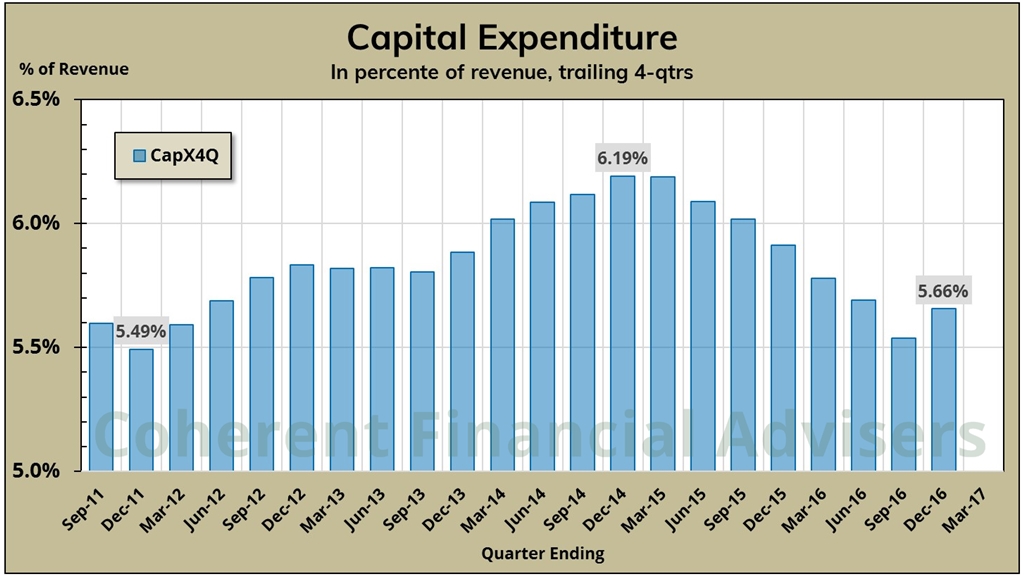
The turn can even be seen in S&P 500 company capital expenditures3. By September, spending on improving long term assets such as equipment and buildings as a percent of revenue had shrunk to the “worst since” 2011 (figure-1). Though far from setting any “best since” records, expenditure turned higher in Q4.
Global GDP growth is another area experiencing improvement. According to the OECD4, “Global GDP growth is projected to increase, rising from just under 3% in 2016 – the slowest pace since 2009 – to 3.3% in 2017 and around 3½ percent in 2018.”
“We’ve turned a corner from “worst since” to “best since”, and that’s refreshing news!”

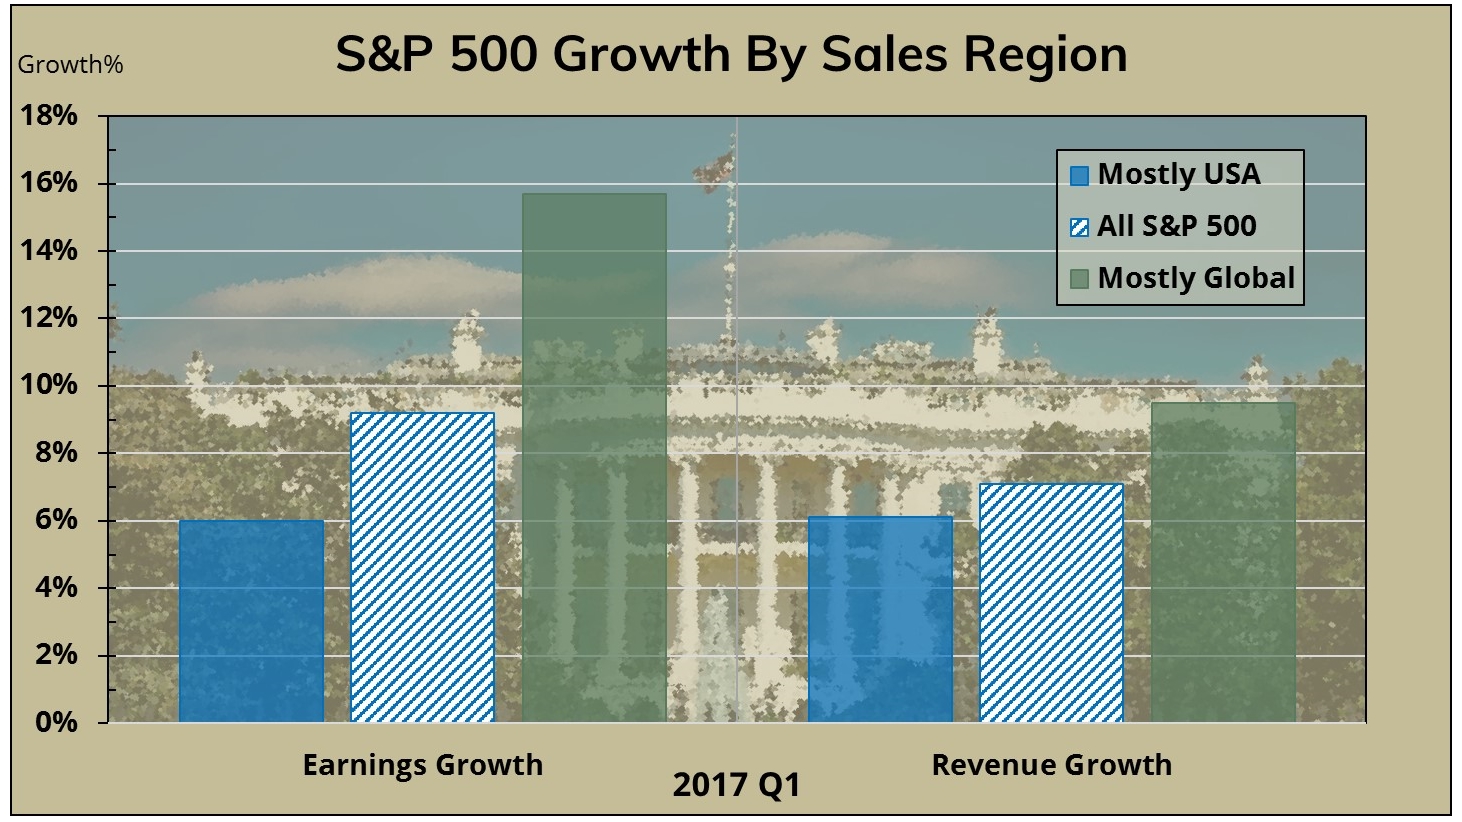
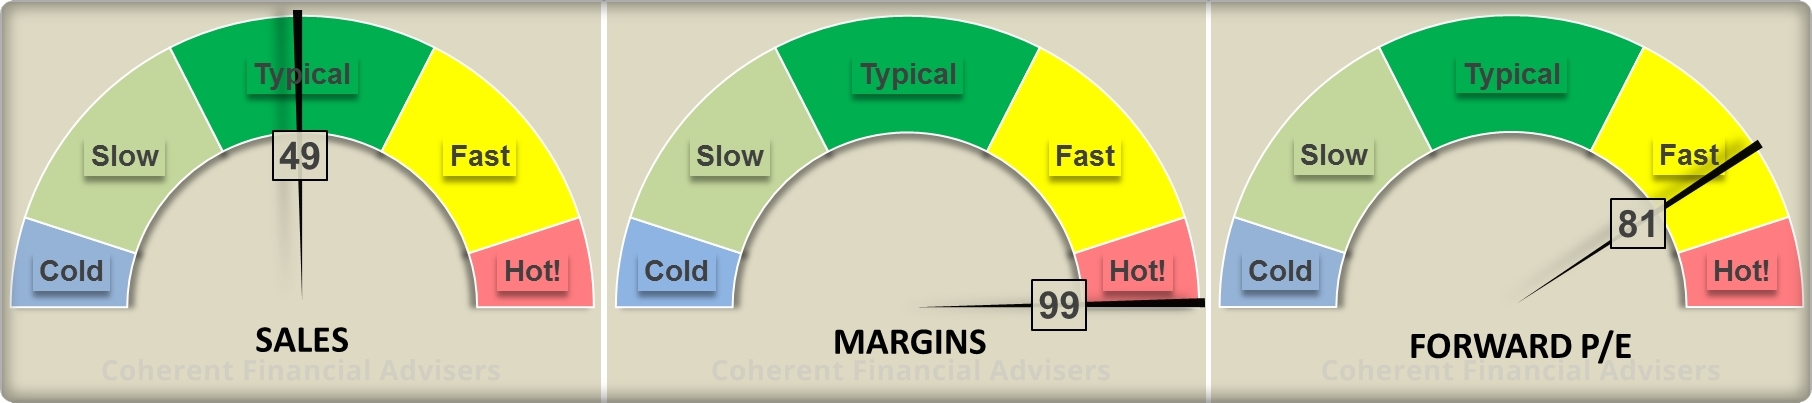
S&P companies generate about 30% of their revenue from outside the USA. According to recent Factset5 Geographic Revenue Exposure data, US companies with higher global exposure have outperformed in both revenue and earnings growth (figure-2).
In an April issue, Factset Research reported, “Coming into the start of Q1 earnings season, a number of companies with higher global exposure are facing the headwind of the stronger U.S. dollar, but may also see a tailwind from higher global GDP growth.”
Reviewing 2017 Earnings
Full year 2016 earnings are now in the books and serve as a constant basis for measuring 2017 performance. S&P companies delivered approximately $106 in operating earnings on $1151 of revenue per share, or about 9.2% margin6. Relative to 2015, earnings grew 5.8%, revenue 2.1%, and margins about 3.9%. This is much better than 2015’s contracting trifecta of -11% earnings, -3% sales and -8% margins.
“While expectations are still optimistic, they have turned from impossible to possible.”
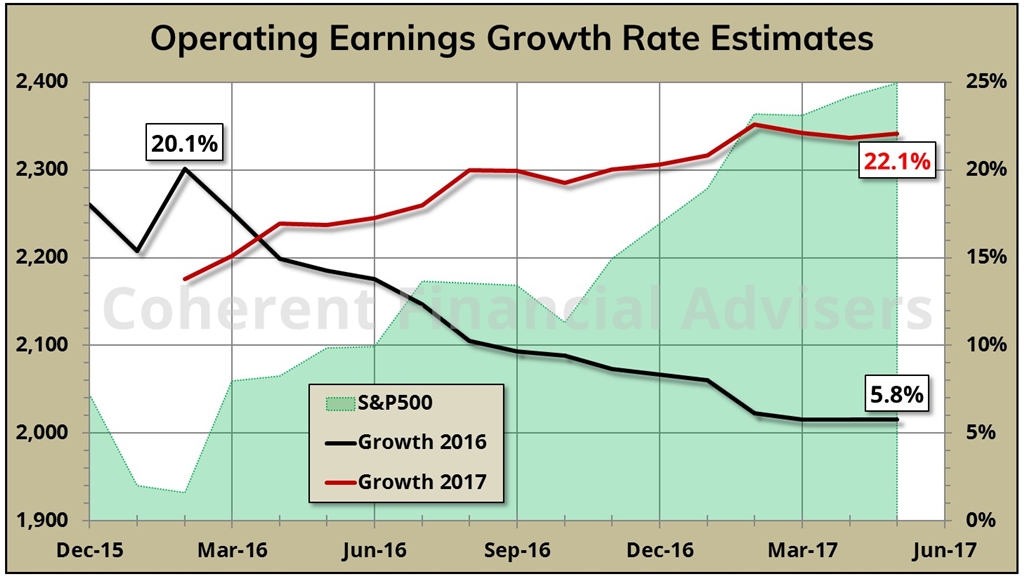
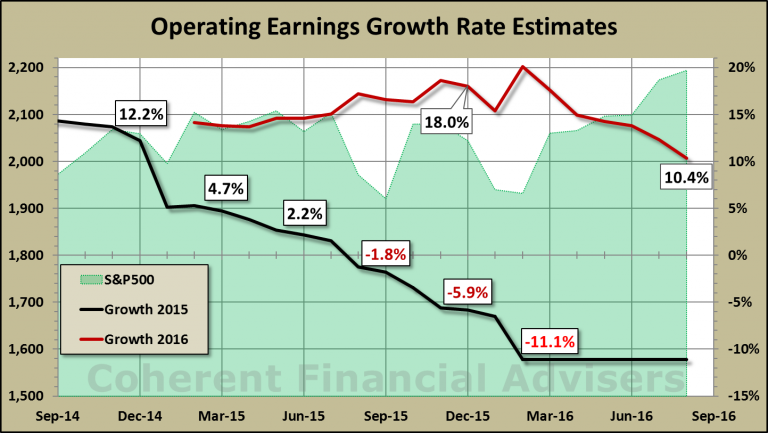
What are the market’s expectations for growth? With over 80% of companies having reported first quarter results, first quarter blended earnings are 2.3% below their beginning of year estimates. Full year 2017 operating earnings outlook remains at 22% growth over 2016 (figure-3) with blended7 earnings estimates at $130 per share.
Are expectations grounded in a reasonable and rational basis? For answers, let’s examine the illustration in figure-4. Please refer to February’s Earnings Insight article for a more detailed explanation of this chart.
The black line in figure-4 shows estimated 2017 quarterly earnings totaling $130 per share, or 22% above last year’s $106. The green and red bars show how much sales or margins would be required to make target earnings, assuming the other holds at its 4-year median rate (horizontal green and red lines).
Turning from impossible to possible
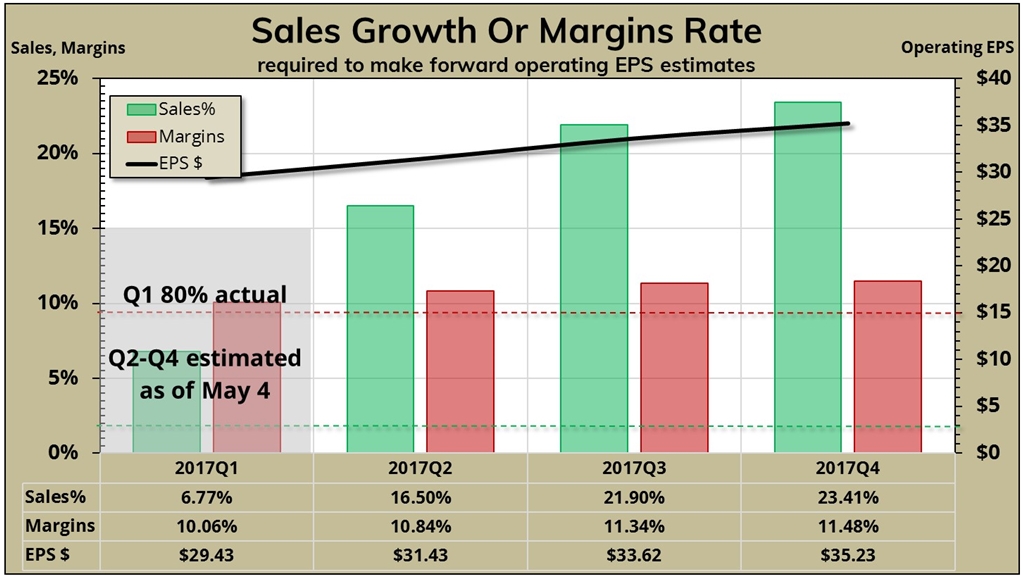
Let’s assume Q1 will finish where it is now. If operating margins track their 4-year median level of 9.5%, sales must grow on average 21% for the remaining three quarters. The highest three quarters we have seen since 2000 averaged 14%, and they were not consecutive.
Conversely, given a 4-year median of 1.9% sales growth, margins must maintain an average exceeding 11% per quarter. The highest rolling 3-quarter operating margins we’ve seen since 2000 averaged nearly 10%, at which sales growth would need to average 14%.
While expectations are still optimistic, they have turned from impossible to possible.
Reflecting Future Expectations
Finally, how much expectation is already priced into the market? By definition, current market prices should fully reflect future expected earnings and growth. The wild card is how much investors are willing to pay for each dollar of earnings.
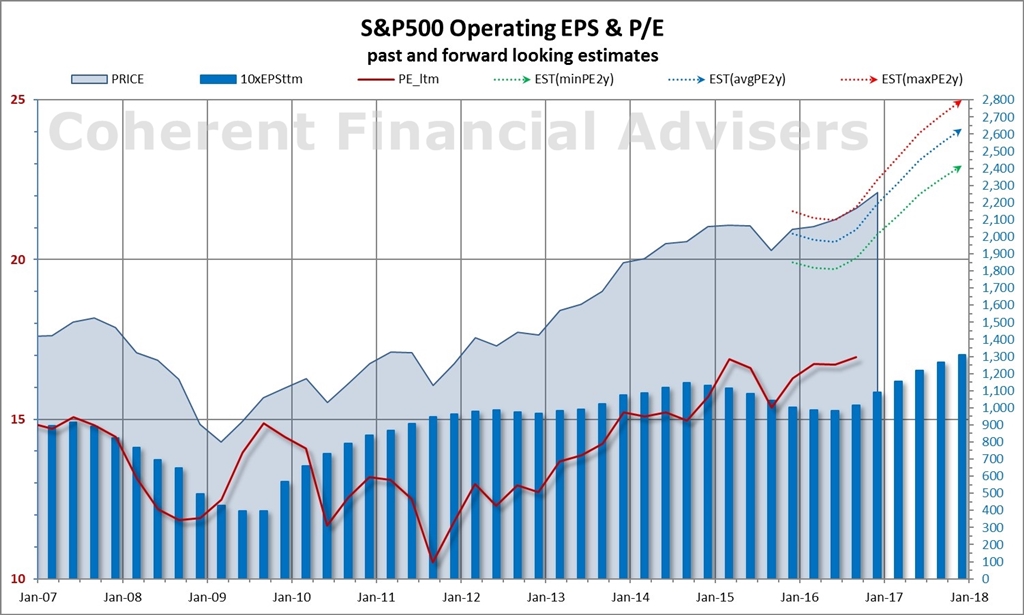
The forward operating price-earnings ratio or “PE” is a measure of what investors are willing to pay for each dollar of expected earnings over the next four quarters. At current S&P 500 Index levels, forward PE is 17.8 – the highest in over 10-years and well above its five-year average of 15 (see chart from Coherent Investor December 2016).
“By definition, current market prices should fully reflect future expected earnings and growth.”
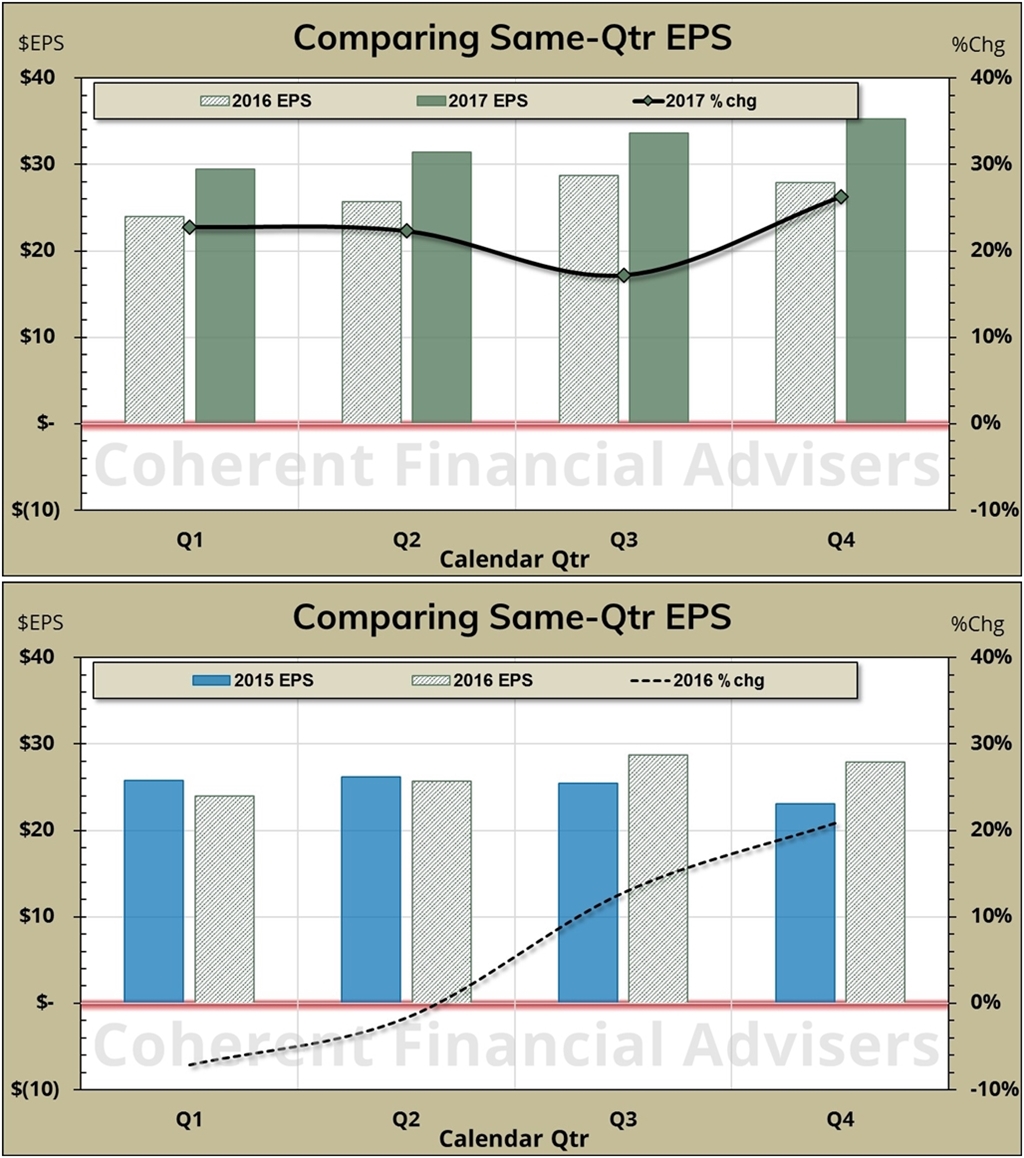
Meanwhile, the silver-lining-tailwind effect of relatively easy comparable EPS growth will have diminished by mid-year. Earnings trended lower in 2015, providing an easier hurdle for 2016 relative growth (figure-6, bottom). Earnings have reversed higher since mid-2016, raising the hurdle for 2017 growth (figure-6, top). If 2017 earnings grow at current estimates, then achieving similar growth in 2018 will be increasingly difficult.
Fundamental factors explain only part of the market’s price behavior. The stock market is as much a study in human behavior as it is a study of fundamental trends. Neither changes very much over time. I guess you could say, “The more things change, the more – some things – stay the same.”
Warm regards,
Sargon Zia, CFA
May 12, 2017
You are welcome to comment!
Recommended Reading:
Earnings Insight February 2017
Coherent Investor: 2017 Possibilities
Manager’s Letter 2017 Q1
Published quarterly, Earnings Insight provides analysis and summary of material trends in aggregate U.S. company earnings as interpreted by the author and Chief Investment Officer of Coherent Financial Advisers.
Footnotes:
- Jean-Baptiste Alphonse Karr, from his monthly journal, Les Guêpes, January 1849, “The more it changes, the more it’s the same thing”.
- In this Earnings Insight series, we focus on key revenue and earnings trends. Our analysis is based primarily on aggregate forward looking estimates of the S&P 500 Index revenue and operating earnings. We want to pay attention to real and recurring drivers of company growth, looking past the non-cash and accounting related practices. Therefore, we have chosen to analyze operating data where possible, rather than as-reported figures usually cited.
- Data source: S&P Dow Jones Indices, us.spindices.com as of May 4, 2017, with more than 80% of S&P 500 companies having reported first quarter earnings. Therefore, full year 2017 estimates are a blend of 20% actual, and 80% estimated figures. Values are rounded for ease of reading. Analysis and interpretation provided by Coherent Financial Advisers.
- The Organisation for Economic Co-operation and Development, OECD Interim Economic Outlook, March 2017, pg-2, “Global GDP growth is projected to increase, rising from just under 3% in 2016 – the slowest pace since 2009 – to 3.3% in 2017 and around 3½ percent in 2018. While the modest pick-up is welcome, it would still leave global GDP growth below the historical average of around 4% in the two decades prior to the crisis.”
- Data source: Factset Research Systems, www.factset.com, May 5, 2017 unless otherwise stated. FactSet Geographic Revenue Exposure data is based on the most recently reported fiscal year data for each company, as reported on April 14, 2017.
- Margin: Expenses are typically measured in terms of earnings left over from, and in proportion to revenue. Given $100 sales and $92 expenses per shares, margin becomes 8% or $8 per $100 of sales. Increasing margins means decreasing expenses in proportion to sales.
- Blended estimates combine actual reported figures with estimates for those companies not yet having reported.


